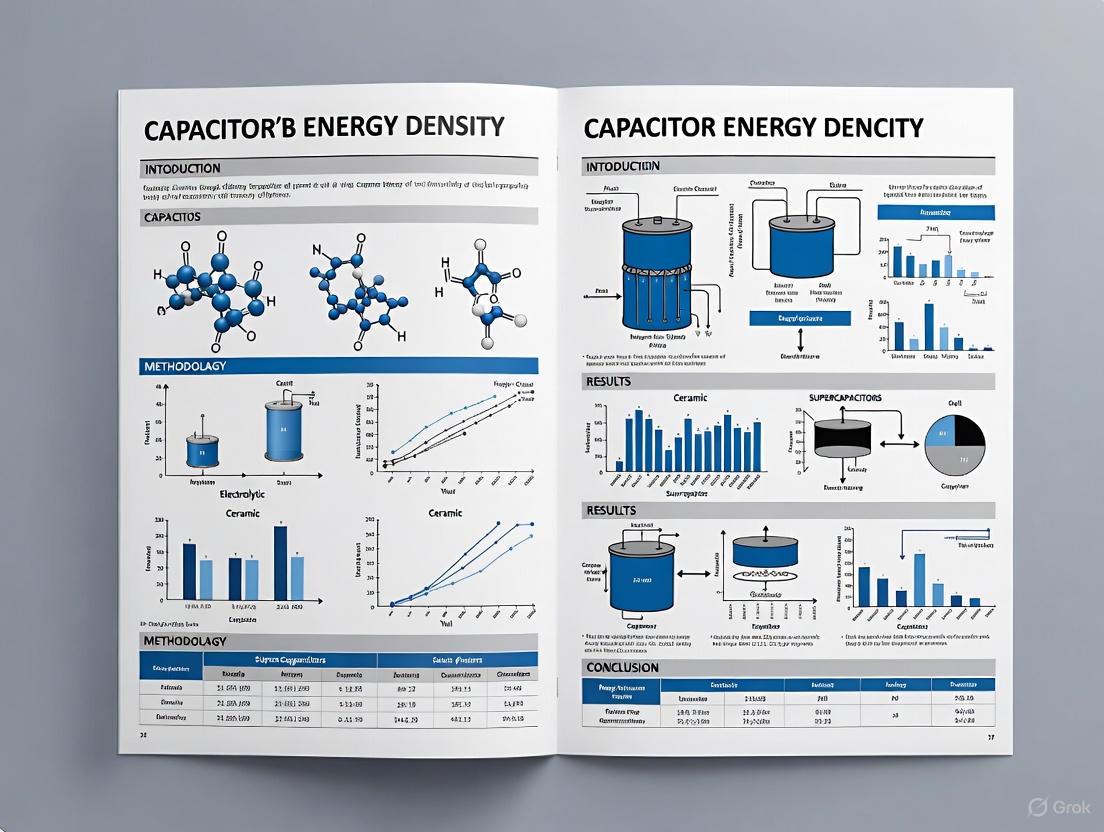
Energy Density Evaluation of Capacitors: A Comprehensive Guide for Research and Development
This article provides a systematic evaluation of energy density across different capacitor technologies, including dielectric capacitors (film, ceramic, electrolytic) and supercapacitors (EDLC, pseudocapacitor, hybrid).
Energy Density Evaluation of Capacitors: A Comprehensive Guide for Research and Development
Abstract
This article provides a systematic evaluation of energy density across different capacitor technologies, including dielectric capacitors (film, ceramic, electrolytic) and supercapacitors (EDLC, pseudocapacitor, hybrid). Aimed at researchers and development professionals, it covers fundamental principles, standardized measurement methodologies, optimization strategies for material and system design, and comparative performance validation. The content addresses critical challenges such as measurement inconsistencies and energy density limitations, while exploring emerging materials and hybrid systems that are shaping the future of high-performance energy storage for advanced applications.
Fundamentals of Capacitor Energy Storage: Principles and Material Classifications
In the field of energy storage, energy density is a pivotal performance metric that defines the amount of energy a device can store per unit volume (Wh/L) or per unit mass (Wh/kg). For capacitive systems, including various classes of capacitors and supercapacitors, this parameter is fundamentally governed by the equation E = ½ * C * V², where E is the energy stored, C is the capacitance, and V is the operating voltage [1]. This simple yet powerful relationship dictates that research efforts to enhance energy density focus primarily on two fronts: maximizing the device's capacitance (C) and expanding its operational voltage window (V).
The pursuit of higher energy density is not merely an academic exercise; it is a critical driver of innovation aimed at narrowing the performance gap between traditional capacitors and batteries. Supercapacitors (also known as ultracapacitors) occupy a unique position in the energy storage landscape, bridging the high-power capabilities of electrolytic capacitors and the high-energy storage of rechargeable batteries [2] [3]. They typically store 10 to 100 times more energy per unit volume or mass than conventional electrolytic capacitors, while maintaining the ability to accept and deliver charge much faster than batteries and tolerate significantly more charge-discharge cycles [2]. This comparison is visually summarized in the Ragone plot, a standard chart for energy storage devices that illustrates the compromise between energy density and power density [4]. Understanding and improving the energy density of these systems is therefore essential for advancing applications ranging from renewable energy integration and fast-charging electronics to regenerative braking in electric vehicles.
Classification and Energy Storage Mechanisms
Capacitive energy storage systems are not monolithic; their performance, particularly their energy density, is intrinsically linked to their underlying charge storage mechanism. These mechanisms can be broadly classified into three categories, which also define the primary types of supercapacitors.
Electrical Double-Layer Capacitors (EDLCs): EDLCs store energy electrostatically through the physical separation of charge at the interface between an electrode and an electrolyte. When voltage is applied, solvated ions in the electrolyte accumulate at the surface of the electrode, forming a so-called Helmholtz double layer with a separation of mere angstroms (0.3–0.8 nm) [2]. This process is highly reversible and non-faradaic, meaning it involves no chemical reactions, which contributes to the exceptional cycle life of EDLCs. The capacitance in EDLCs is primarily a function of the electrode's specific surface area accessible to electrolyte ions [2] [4]. Electrodes are typically made from high-surface-area carbon materials, such as activated carbon, carbon nanotubes, graphene, or ordered mesoporous carbons like CMK-3 and CMK-5 [4] [5].
Pseudocapacitors: In contrast, pseudocapacitors store energy through faradaic processes, which involve the rapid and reversible transfer of charge between the electrolyte and the electrode surface via redox reactions, electrosorption, or intercalation [2]. While this can yield a significantly higher capacitance than pure EDLCs, it is technically a battery-like behavior. The term "pseudocapacitance" is used because the electrical characteristics, such as a linear discharge curve, resemble those of a capacitor. Common pseudocapacitive materials include transition metal oxides (e.g., RuO₂, MnO₂) and conducting polymers (e.g., PEDOT, PANI) [4].
Hybrid Capacitors: Hybrid systems aim to combine the best of both worlds by integrating a capacitive or EDLC-type electrode with a battery-like or pseudocapacitive electrode [4]. This design strategy can simultaneously boost both energy density (from the faradaic component) and power density (from the capacitive component). Another form of hybridization involves using asymmetric electrodes, where both electrodes are carbon-based but have different capacitances or potential windows, thereby maximizing the cell's overall operating voltage [1]. A recent example is an aqueous hybrid electrochemical capacitor using a conductive polymer positive electrode and a porous carbon nanotube negative electrode [6].
The following diagram illustrates the logical relationship between these different capacitive systems based on their energy storage mechanisms.
Performance Comparison of Capacitive Systems
The energy density of capacitive systems varies dramatically across different types and technology generations. The following table provides a comparative overview of the energy densities reported for various systems, from commercial devices to recent research breakthroughs.
Table 1: Energy Density Comparison of Different Capacitive Systems
| Capacitor Type | Specific Energy Density (Wh/kg) | Volumetric Energy Density (Wh/L) | Key Characteristics | Source / Reference |
|---|---|---|---|---|
| Traditional Capacitors | < 0.1 | < 0.1 | Very high power density, low energy storage. | [2] |
| Industrial EDLCs (2002) | ~2.5 (Device level) | ~7 (Device level) | Early commercial supercapacitors. | [1] |
| Industrial EDLCs (2016) | ~4 (Device level) | ~10 (Device level) | Incremental improvement via voltage & design. | [1] |
| Modern Commercial SC (Gen 1) | N/A | ~10 (Device level) | 4x power density vs. competitors. | [7] |
| Graphene SC (Gen 2) | N/A | 16 (Device level) | 72% increase from previous generation. | [1] [7] |
| CMK-5/SWNT EDLC | 8.4 (Device level) | 12.2 (Device level) | High capacitance from bimodal mesoporosity. | [8] |
| Aqueous Hybrid EC | N/A | 1.29 mF V² cm⁻² (Areal) | For AC line filtering; integrable to 1000 V. | [6] |
| Advanced Fiber SC (KIST/SNU) | 418 (Electrode level) | 820 mWh/cm³ (Volumetric) | Record-setting; uses CNT/PANI composite fibers. | [9] |
This comparison reveals a clear trend: while commercially available devices have seen gradual, incremental improvements in energy density (e.g., from 7 Wh/L to 16 Wh/L over nearly two decades) [1] [7], academic research frequently reports dramatically higher values. A recent breakthrough from South Korea, for instance, demonstrated a fiber-based supercapacitor with an energy density of 418 Wh/kg at the electrode level, a figure that competes with some battery technologies [9]. This stark discrepancy highlights the significant challenge of translating laboratory-scale material innovations into robust, cost-effective, and commercially viable devices [1].
Key Metrics and Performance Indicators
Evaluating the energy density of capacitive systems requires a holistic view that extends beyond a single number. A comprehensive assessment involves several interconnected key metrics and performance indicators.
Capacitance (C): The fundamental ability of a device to store electrical charge. For supercapacitors, it is determined by the equation C = (ε₀ * εᵣ * A) / d, where
Ais the electrochemically accessible surface area of the electrode, anddis the effective charge separation distance in the double layer [1]. This underscores the critical importance of developing electrode materials with very high specific surface area and pore structures that are optimally sized for the electrolyte ions [4] [5].Operating Voltage (V): Perhaps the most critical factor for energy density due to the squared relationship in the energy equation. The operational voltage window of a supercapacitor is not an intrinsic property of the electrode material alone but is dictated by the electrochemical stability of the electrolyte at the electrode-electrolyte interface [1]. Strategies to increase voltage include using organic electrolytes (e.g., ~3.0 V), formulating "water-in-salt" electrolytes, and engineering asymmetric or hybrid devices to fully exploit the stable potential range of each electrode [6] [1].
Power Density: The rate at which energy can be delivered or absorbed. It is inversely related to the device's equivalent series resistance (ESR). High power density is a hallmark of supercapacitors and is essential for applications like regenerative braking and AC line filtering [2] [5]. The resistance-capacitance (RC) time constant is a key indicator of frequency response, with lower values (e.g., < 1 ms) enabling faster charging and discharging [6].
Cycle Life and Stability: The ability of a device to retain its performance over thousands or millions of charge-discharge cycles. EDLCs typically excel in this area, often enduring over 1,000,000 cycles [2] [7]. Stability is often quantified through capacitance retention percentages after extended cycling or floating (holding at a high voltage) [8].
Detailed Experimental Protocols and Methodologies
To provide a concrete understanding of how energy density is engineered and measured in modern research, this section details the methodologies from two seminal studies.
Protocol 1: Development of a High-Energy CMK-5/SWNT EDLC
This study focused on enhancing both capacitance and voltage in an Electrical Double-Layer Capacitor (EDLC) through sophisticated material design [8] [5].
Electrode Fabrication:
- Material Synthesis: The ordered mesoporous carbon CMK-5 was synthesized using SBA-15 mesoporous silica as a hard template. Furfuryl alcohol (FA) was infiltrated into the silica's pores and subsequently polymerized and carbonized through multistep heat treatment. The silica template was then removed with hydrofluoric acid (HF), yielding hexagonally arrayed hollow carbon tubes [5].
- Electrode Formulation: The CMK-5 powder was mixed with 10 wt% Single-Walled Carbon Nanotubes (SWNTs), which served as a conductive additive and binder. This mixture was formed into a thin film on a current collector.
Device Assembly:
- A symmetric two-electrode coin cell was assembled with the CMK-5/SWNT films as both electrodes.
- An organic electrolyte, specifically 1 M Tetraethylammonium tetrafluoroborate (TEABF₄) in Acetonitrile (ACN), was used to achieve a high operating voltage of 2.8 V [5]. A cellulose-based separator was used to prevent electrical shorting.
Electrochemical Testing & Analysis:
- Cyclic Voltammetry (CV): Performed at very high scan rates (up to 500 V/s) to confirm ideal capacitive behavior (rectangular CV curves) and evaluate power performance [5].
- Galvanostatic Charge-Discharge (GCD): Conducted at various current densities to calculate the specific capacitance from the discharge curve. The energy density (E) was then calculated using the formula: E = ½ * C * V² [1] [8].
- Lifetime Testing: The device was subjected to a "float test" at an elevated temperature (2.85 V and 65 °C) for 1400 hours to assess long-term stability, demonstrating 77% capacitance retention [8].
The experimental workflow for this protocol is summarized below.
Protocol 2: Fabrication of an Aqueous Hybrid Electrochemical Capacitor
This protocol demonstrates an alternative approach, creating a high-performance, flexible hybrid device using aqueous electrolytes [6].
Electrode Preparation:
- Positive Electrode: A Continuous PEDOT Nanomesh (CPN) film was synthesized by spin-coating a PEDOT:PSS/DMSO solution onto porous cellulose paper, followed by treatment with concentrated sulfuric acid to enhance conductivity (2.7 × 10³ S/cm).
- Negative Electrode: A porous Carbon Nanotube (p-CNT) film was created by exfoliating CNT paper etched with H₂O₂, resulting in a defective, porous structure with high conductivity (1.8 × 10³ S/cm).
Device Assembly and Integration:
- A single sandwich-structured cell was assembled using the CPN film (positive), p-CNT film (negative), and a cellulose diaphragm separator moistened with 3 M H₂SO₄ aqueous electrolyte.
- For high-voltage applications, a scalable Orderly Aligned Scrolling (OAS) strategy was employed. Multiple single units were connected in series and sealed with soft tapes to create integrated devices (e.g., 7, 67, or 670 units) [6].
Performance and Filtering Characterization:
- The capacitance and phase angle were measured at 120 Hz, the standard frequency for AC line filtering.
- The areal specific energy density (EA) was calculated using the formula EA = ½ * C_A * V², where
C_Ais the areal capacitance. - The filtering performance was tested by integrating the device into a circuit with a triboelectric nanogenerator (RD-TENG) to smooth a pulsed AC signal into a stable DC output.
The Scientist's Toolkit: Essential Research Reagents and Materials
The advancement of capacitive energy density is heavily dependent on the selection and synthesis of specialized materials. The following table catalogues key reagents and their functions as featured in the cited research.
Table 2: Key Research Reagents and Materials for High-Energy Density Capacitors
| Material / Reagent | Function in Research | Example from Literature |
|---|---|---|
| Curved Graphene | A patented carbon nanomaterial offering high surface area and conductivity, used to boost both energy and power density in commercial devices. | Skeleton Technologies' Gen 2 supercapacitors (16 Wh/L) [1] [7]. |
| Ordered Mesoporous Carbons (CMK-3, CMK-5) | Templated carbon structures with well-defined, straight pores for high ion accessibility and high specific surface area, leading to high capacitance. | CMK-5/SWNT EDLC demonstrator (12.2 Wh/L) [8] [5]. |
| Carbide-Derived Carbon (CDC) | Carbon material produced by etching metal from metal carbides; pore size can be tuned for optimal ion matching, enhancing volumetric capacitance. | Cited as a key material for advanced supercapacitor electrodes [4]. |
| Single-Walled Carbon Nanotubes (SWNTs) | Act as a highly conductive additive and binder in composite electrodes, facilitating electron transport and mechanical integrity. | Used in CMK-5 composite electrodes [5] and as a primary material in fiber-based supercapacitors [9]. |
| Conducting Polymers (PEDOT, PANI) | Provide pseudocapacitance via rapid faradaic redox reactions, significantly increasing capacitance compared to pure carbon EDLCs. | PEDOT used in aqueous hybrid capacitors [6]; PANI with CNTs in record-energy-density fiber SC [9]. |
| Acetonitrile (ACN) Solvent | A common organic solvent for electrolytes, enabling a wide operating voltage window (~3.0 V) and high ionic conductivity. | Used in the CMK-5/SWNT EDLC (2.8 V operation) [8] [5]. |
| Pyrrolidinium-based Salts | Advanced conductive salts for organic electrolytes, contributing to high voltage operation and stability. | Used in a high-energy 5000 F demonstrator cell [8]. |
| Aqueous H₂SO₄ Electrolyte | Inexpensive, safe, and highly conductive electrolyte. Used in hybrid devices where voltage is scaled via integration. | 3 M H₂SO₄ used in the Aqueous Hybrid (ACPEC) device [6]. |
The rigorous definition and enhancement of energy density remain central to the research and development of advanced capacitive systems. As detailed in this guide, key metrics such as capacitance, operating voltage, and power density are interdependent performance indicators that must be optimized in concert. The experimental protocols reveal that progress is fundamentally driven by innovations in material science—from the synthesis of curved graphene and ordered mesoporous carbons for EDLCs to the nanoscale engineering of conductive polymers and carbon nanotubes for hybrid and pseudocapacitive systems.
Despite the promising record-breaking energy densities reported in academic research, a significant translational gap persists between laboratory discoveries and commercially available devices. Bridging this gap requires a research paradigm that not only pursues maximal performance but also critically assesses practical constraints, including cost-effectiveness, manufacturability, scalability, and device lifetime [1]. Future research directions will likely involve the continued refinement of machine learning models to predict material properties [10], the development of novel solid-state or hybrid electrolytes, and the design of more sophisticated device architectures. For researchers in the field, a deep understanding of these key metrics, coupled with the methodologies to accurately measure them, is indispensable for contributing to the next generation of high-performance energy storage solutions.
The evaluation of energy density is a central challenge in the development of advanced energy storage devices. This guide provides a comparative analysis of three fundamental charge storage mechanisms—electrostatic, electrochemical, and hybrid processes—synthesizing current research to outline their distinct operational principles, performance boundaries, and experimental characterization methodologies. As the demand for devices that simultaneously offer high energy and power density intensifies, understanding the synergies and trade-offs between these mechanisms becomes critical for guiding material selection and system design in applications ranging from portable electronics to grid storage and electric vehicles.
Fundamental Charge Storage Mechanisms
Electrostatic Storage (Electric Double-Layer Capacitance)
Electrostatic storage, the mechanism underpinning Electric Double-Layer Capacitors (EDLCs), relies on the physical separation of charge without Faradaic (redox) reactions. When a voltage is applied across two porous electrodes immersed in an electrolyte, ions from the electrolyte migrate and form a nanoscale charge separation layer at the electrode-electrolyte interface, known as the electric double layer [11]. This process is highly reversible and rapid, leading to exceptional power density and cycle life.
The formation of the double layer is described by several classical models [11]:
- Helmholtz Model: Posits a rigid, single layer of ions adsorbed at the electrode surface.
- Gouy-Chapman Model: Considers a diffuse ion layer due to thermal motion, improving upon the Helmholtz model but failing for highly charged interfaces.
- Stern Model: A hybrid approach that integrates both concepts, defining two distinct regions—a compact Stern layer (comprising the Inner and Outer Helmholtz Planes) and a diffuse Gouy-Chapman layer.
The capacitance in EDLCs is primarily influenced by the electrode surface area and electrolyte composition. Carbon-based materials like activated carbon, graphene, and carbon nanotubes are predominantly used due to their high surface area, electrical conductivity, and tunable pore structures [11].
Electrochemical Storage (Batteries and Pseudocapacitance)
Electrochemical storage involves Faradaic processes, where charge is transferred across the electrode-electrolyte interface via reversible redox reactions. This mechanism is the basis for batteries and pseudocapacitors and typically results in significantly higher energy density than purely electrostatic storage.
Two primary electrochemical mechanisms exist:
- Battery-Type Storage: In devices like lithium-ion batteries, energy storage occurs via bulk redox reactions that involve phase transformations and solid-state diffusion of ions into the electrode material. While this yields high energy density, the diffusion process limits power density and cycle life [11] [12].
- Pseudocapacitance: This process exhibits a capacitive-like, non-diffusion-limited behavior despite being Faradaic. Charge storage involves fast, reversible surface or near-surface redox reactions, electrosorption, or intercalation, where the current response is directly proportional to the scan rate in cyclic voltammetry. Materials such as transition metal oxides (e.g., RuO₂, MnO₂) and conductive polymers are common pseudocapacitive electrodes [11].
Hybrid Storage Processes
Hybrid processes combine electrostatic and electrochemical mechanisms within a single device to overcome the limitations of either system alone. The goal is to merge the high power density and long cycle life of supercapacitors with the high energy density of batteries [12] [13]. Hybrid systems can be realized through several architectures [14] [12]:
- Composite Electrodes: Designing electrode materials that intrinsically exhibit both EDLC and pseudocapacitive properties (e.g., nitrogen-doped carbon nanostructures).
- Asymmetric Devices: Pairing a battery-type (or pseudocapacitive) electrode with a capacitive carbon electrode.
- Redox Additives in Electrolyte: Introducing molecular redox-active species (e.g., hydroquinone) into the electrolyte to provide additional Faradaic capacity alongside the double-layer capacitance [15].
- Device-Level Hybridization: Connecting a distinct supercapacitor and a battery in a hybrid energy storage system (HESS) at the pack or circuit level, often managed by power electronics [14] [16].
Comparative Performance Data
The following tables summarize the key quantitative performance metrics and application parameters for devices based on these charge storage mechanisms.
Table 1: Quantitative Performance Comparison of Energy Storage Devices [11] [17] [12]
| Performance Parameter | Electrostatic (EDLC) | Electrochemical (Li-ion Battery) | Hybrid Supercapacitor |
|---|---|---|---|
| Energy Density (Wh/kg) | 4 - 10 [11] | 150 - 250 [11] | 15 - 50+ [11] [12] |
| Power Density (W/kg) | 10,000 - 50,000 [11] | 500 - 2,000 [11] | 1,000 - 10,000 [12] |
| Cycle Life (cycles) | 100,000 - 500,000 [11] [17] | 1,000 - 6,000 [11] [17] | 10,000 - 50,000 [12] |
| Charge/Discharge Time | Seconds to minutes [11] | Hours [11] | Minutes to hours [12] |
| Cycle Efficiency | >99.9% [11] | 85 - 98% [12] | 90 - 98% [12] |
| Key Limitation | Low energy density [11] | Limited power density, cycle life [11] | Trade-off between energy density & cycle stability [15] |
Table 2: Mechanism and Application Profile
| Characteristic | Electrostatic | Electrochemical (Battery) | Hybrid |
|---|---|---|---|
| Storage Mechanism | Non-Faradaic, ion adsorption [11] | Faradaic, bulk redox & diffusion [11] | Combined Faradaic & non-Faradaic [12] |
| Rate Capability | Very High | Moderate to Low | High |
| Response Time | Milliseconds [17] | Seconds to Minutes | Milliseconds to Seconds [13] |
| Primary Applications | Regenerative braking, power backup, peak shaving [14] | EVs, portable electronics, grid storage [12] | High-power EVs, renewable energy smoothing, industrial equipment [12] [16] |
| Degradation Mode | Pore structure collapse, electrolyte decomposition [11] | Active material loss, SEI growth, phase change [12] | Combination of both mechanisms [15] |
Experimental Protocols for Mechanism Investigation
Protocol: Cyclic Voltammetry (CV) for Mechanism Identification
Objective: To distinguish between capacitive and battery-like behavior based on the current response to a linearly scanned voltage [11].
- Equipment Setup: A standard three-electrode cell (working electrode, counter electrode, reference electrode) connected to a potentiostat.
- Electrode Preparation: The active material (e.g., 5 mg) is mixed with a conductive agent (carbon black, 1 mg) and a binder (PVDF, 0.5 mg) in a solvent (NMP) to form a slurry. This slurry is coated onto a current collector (e.g., nickel foam) and dried under vacuum.
- Experimental Procedure: The potential of the working electrode is scanned between set limits (e.g., 0 - 0.8 V vs. Ag/AgCl) at multiple scan rates (e.g., 5, 10, 20, 50 mV/s).
- Data Analysis:
- EDLC Behavior: A nearly rectangular-shaped CV curve indicates ideal capacitive behavior.
- Pseudocapacitive Behavior: Redox peaks are present, but the shape remains relatively rectangular. The current (i) follows the power-law relationship with scan rate (v): ( i = a v^b ), where b-value close to 1.0 indicates capacitive-controlled processes.
- Battery-like Behavior: Sharp, distinct redox peaks are observed, and the b-value is close to 0.5, signifying a diffusion-controlled process.
Protocol: Galvanostatic Charge-Discharge (GCD) for Performance Quantification
Objective: To accurately measure specific capacitance, energy density, power density, and cycling stability [11] [18].
- Cell Assembly: A two-electrode symmetric or asymmetric coin cell is typically assembled in a glovebox.
- Electrolyte Selection: Common electrolytes include aqueous (e.g., 1 M KOH, 1 M H₂SO₄) or organic (e.g., 1 M TEABF₄ in acetonitrile) solutions, selected based on the desired operating voltage window.
- Testing Procedure: The cell is charged and discharged at constant current densities between specified voltage limits for thousands of cycles.
- Calculations:
- Specific Capacitance (F/g): Calculated from the discharge curve using ( C = (I \Delta t) / (m \Delta V) ), where I is current, Δt is discharge time, m is active mass, and ΔV is voltage window.
- Energy Density (Wh/kg): ( E = (0.5 \times C \times \Delta V^2) / 3.6 )
- Power Density (W/kg): ( P = E / \Delta t \times 3600 )
Protocol: Investigating Hybrid Systems with Redox Additives
Objective: To evaluate the trade-off between enhanced energy density and cycle stability in hybrid capacitors using redox-active electrolytes [15].
- Electrolyte Preparation: A baseline electrolyte (e.g., 1 M TEABF₄ in acetonitrile) is prepared. Hydroquinone (HQ) is added as a redox additive at varying concentrations (e.g., 0.1 M, 0.2 M).
- Device Testing: Carbon-based symmetric cells are assembled and tested using GCD and CV at different current densities.
- Data Analysis:
- Monitor the increase in discharge time (and thus capacitance) with increasing HQ concentration.
- Track the Coulombic efficiency and capacity retention over thousands of cycles. The system may require a certain number of cycles to reach a steady state as the redox additives stabilize [15].
- Distinguish between "capacitive" and "Faradaic" regimes based on the shape of the potential-time curve during GCD.
Schematic Visualization of Mechanisms
Electrostatic Charge Storage (EDLC)
The following diagram illustrates the formation of the electric double layer at the electrode-electrolyte interface according to the Stern model, showing the ion arrangement that enables purely physical charge storage.
Electrochemical Charge Storage
This diagram contrasts the two primary electrochemical mechanisms: battery-type storage involving bulk ion diffusion and pseudocapacitance relying on fast surface redox reactions.
Hybrid Storage System Operation
This diagram outlines the operational principle of a device-level hybrid energy storage system, where a power-dense component and an energy-dense component are managed to meet variable load demands.
The Scientist's Toolkit: Essential Research Reagents and Materials
Table 3: Key Materials and Reagents for Investigating Charge Storage Mechanisms
| Material / Reagent | Function in Research | Example Usage |
|---|---|---|
| Activated Carbon | High-surface-area electrode material for studying pure EDLC behavior. | Fabricating symmetric supercapacitors to establish baseline capacitive performance [11]. |
| Transition Metal Oxides (e.g., RuO₂, MnO₂, Ni(OH)₂) | Pseudocapacitive electrode materials that undergo surface redox reactions. | Investigating the interplay between surface area and Faradaic activity in hybrid mechanisms [11] [18]. |
| Redox Additives (e.g., Hydroquinone, KI) | Molecules added to the electrolyte to introduce additional Faradaic capacity. | Studying the trade-offs between energy density gains and cycle stability in hybrid capacitors [15]. |
| Conductive Polymers (e.g., PANI, PPy) | Materials exhibiting both electronic conductivity and pseudocapacitance. | Developing composite electrodes for asymmetric hybrid devices [11]. |
| Aqueous KOH/H₂SO₄ Electrolyte | High-conductivity electrolyte for fundamental mechanism studies. | Used in three-electrode cells for initial CV and GCD characterization of new materials [11] [18]. |
| Organic Electrolyte (TEABF₄ in Acetonitrile) | Provides a wider voltage window (>2.5 V) than aqueous electrolytes. | Testing full devices to achieve higher practical energy densities [11] [15]. |
| Coordination Polymers / MOFs | Tunable, high-surface-area materials with potential for both EDLC and Faradaic storage. | Exploring novel high-density electrode materials and their complex charge storage mechanisms [18]. |
Capacitors, essential components in modern electronics, can be broadly categorized into two distinct families based on their fundamental energy storage mechanisms: dielectric capacitors and supercapacitors. This taxonomy is critical for researchers, particularly in fields requiring precise energy management, as the choice between these technologies dictates the performance, efficiency, and application scope of electronic systems and power supplies.
Dielectric capacitors, which include traditional film types like polypropylene and advanced ceramic multilayer (MLCC) variants, store energy electrostatically through charge displacement in a solid dielectric material. They are characterized by exceptionally high power density and rapid charge/discharge cycles, often in the microsecond to millisecond range [19] [20]. In contrast, supercapacitors (electrochemical capacitors) store energy electrochemically at the interface between an electrode and an electrolyte. This mechanism enables them to achieve energy densities orders of magnitude greater than dielectric capacitors, though typically at slower operational speeds and with different lifecycle characteristics [21] [22].
Understanding this fundamental divergence is the first step in selecting the appropriate capacitor technology for specific research and development goals, especially when evaluating energy density—a key parameter in energy storage research.
Capacitor Classification and Energy Storage Mechanisms
The following diagram illustrates the taxonomic hierarchy of capacitor technologies, highlighting their structural and mechanistic relationships.
Dielectric Capacitors: Electrostatic Storage
Dielectric capacitors function as passive two-terminal electronic components that store energy by accumulating positive and negative charges on two parallel plates separated by an insulating dielectric material. When a voltage is applied, an electric field forms across the dielectric, resulting in the storage of electrical energy. The capacitance is determined by the surface area of the plates, the distance between them, and the dielectric constant of the insulating material [20].
Key subtypes include:
- Polymer Film Capacitors: Utilize a thin plastic film as the dielectric, known for high insulation resistance and low losses, making them ideal for AC and pulse applications [20].
- Ceramic Capacitors (MLCC): Employ a ceramic dielectric and are characterized by their small size, high stability, and suitability for high-frequency applications [20].
- Electrolytic Capacitors: Use a metal anode covered by an oxide layer as the dielectric, offering high capacitance per unit volume. Their polarized nature makes them suitable for DC power supply filtering [20].
Supercapacitors: Electrochemical Storage
Supercapacitors store energy through ion accumulation or surface redox reactions at the electrode-electrolyte interface. They bridge the performance gap between traditional dielectric capacitors and batteries, offering higher power density than batteries and significantly greater energy density than dielectric capacitors [21] [22].
Key subtypes include:
- Electric Double-Layer Capacitors (EDLC): The most common and mature type, EDLCs store energy electrostatically via charge separation at the electrode-electrolyte interface (the Helmholtz double layer). They typically use high-surface-area porous carbon electrodes, providing high power density and exceptional cycle life (hundreds of thousands to millions of cycles), though with moderate energy density [21] [22] [23].
- Pseudocapacitors: These devices store energy through fast, reversible Faradaic reactions (redox processes) on the surface of electroactive materials like metal oxides (e.g., ruthenium oxide) or conducting polymers. This mechanism allows for higher energy density than EDLCs but often at the cost of reduced power density and cycle life [21] [22].
- Hybrid Capacitors: Combining features of both EDLCs and pseudocapacitors, hybrid designs integrate one capacitive electrode (typically carbon-based) with one battery-like or pseudocapacitive electrode (e.g., lithium-ion or sodium-ion intercalation materials). This architecture aims to synergize the high power and long cycle life of EDLCs with the enhanced energy density of Faradaic processes [21] [24].
Performance Comparison: Quantitative Data Analysis
The selection of capacitor technology for a specific application requires a clear understanding of key performance metrics. The following table provides a comparative overview of the primary characteristics of different capacitor types, based on current commercial and research data.
Table 1: Performance Comparison of Different Capacitor Types
| Capacitor Type | Energy Density | Power Density | Cycle Life | Charge/Discharge Time | Key Strengths |
|---|---|---|---|---|---|
| Dielectric (Polymer Film) | Very Low (0.01-0.1 J/cm³) [19] | Very High (up to 106 W/kg) [20] | Virtually Unlimited | Microseconds to Milliseconds [20] | Ultra-high power density, fast response, high reliability |
| Supercapacitor (EDLC) | Moderate (4-10 Wh/kg) [21] [25] | High (1-10 kW/kg) [22] | >100,000 cycles [21] | Seconds to Minutes [22] | Excellent cycle life, high power, good temperature range |
| Supercapacitor (Hybrid) | High (up to 42 Wh/kg demonstrated) [24] | Moderate to High | ~10,000 cycles (demonstrated) [24] | Seconds to Minutes [24] | Balanced energy and power density, improving technology |
Table 2: Material Composition and Typical Applications
| Capacitor Type | Typial Dielectric/Electrode Materials | Typical Electrolyte | Common Applications |
|---|---|---|---|
| Dielectric (Polymer Film) | Polypropylene, Polyester [20] | Solid Polymer / Not Applicable | Snubber circuits, resonant circuits, filters [20] |
| Supercapacitor (EDLC) | High-surface-area Activated Carbon [22] [23] | Organic Solvent or Aqueous Salt Solutions [22] | Energy recovery, memory backup, UPS [21] [26] |
| Supercapacitor (Hybrid) | Carbon Anode + Battery-type Cathode (e.g., Li/Na-ion) [24] | Organic Lithium/ Sodium Salts [24] | High-power pulsed equipment, some consumer electronics [24] |
Experimental Protocols for Energy Density Evaluation
Standardized experimental protocols are essential for the accurate and comparable evaluation of capacitor energy density. The following section details key methodologies relevant to both dielectric and electrochemical capacitor research.
Constant Current Charge-Discharge Cycling
This is the most direct method for measuring the capacity and efficiency of supercapacitors.
- Principle: The device is charged to a set voltage at a constant current, then discharged to a cutoff voltage at the same or different constant current. The energy delivered during discharge is integrated.
- Procedure:
- Setup: Place the capacitor in a temperature-controlled chamber (e.g., 25°C). Connect it to a potentiostat/galvanostat system.
- Polarization: Apply a constant current until the rated voltage (UR) is reached.
- Rest: Allow a brief open-circuit rest period (e.g., 30 seconds).
- Discharge: Discharge the capacitor at a constant current to the lower voltage limit (UL).
- Data Analysis: The discharge energy (E) in Watt-hours (Wh) is calculated from the integral of the discharge power curve: ( E = \int{t1}^{t_2} V(t) \cdot I \cdot dt / 3600 ). The specific energy density is then derived by normalizing E to the mass or volume of the active materials or the entire device [26] [24].
- Application: This method is universally applicable to all supercapacitor types (EDLC, pseudocapacitor, hybrid) and is a standard for performance reporting [24].
Cyclic Voltammetry (CV) for Capacitance and Mechanism Analysis
CV is used to characterize capacitive behavior, reaction reversibility, and to distinguish between capacitive and battery-like storage mechanisms.
- Principle: The voltage of the working electrode is scanned linearly with time between two set limits while the current is measured.
- Procedure:
- Setup: Configure a standard three-electrode cell (working, counter, reference) for material studies or a two-electrode coin cell for full device testing.
- Scanning: Run CV scans at varying rates (e.g., from 1 mV/s to 100 mV/s).
- Analysis:
- EDLC Behavior: A nearly rectangular-shaped CV curve indicates ideal double-layer capacitive behavior.
- Pseudocapacitive Behavior: The presence of redox peaks indicates Faradaic reactions.
- Capacitance Calculation: The capacitance (C) can be calculated from a CV cycle using the formula: ( C = \frac{\int i \, dV}{2 \cdot v \cdot \Delta V} ), where ( i ) is the current, ( v ) is the scan rate, and ( \Delta V ) is the voltage window [23].
Charge-Discharge Efficiency and Cycle Life Testing
This long-term test evaluates the device's performance retention and reliability under repeated operation.
- Principle: The capacitor is subjected to thousands of repeated charge-discharge cycles to assess degradation.
- Procedure:
- Baseline Testing: Perform initial capacity and internal resistance (ESR) measurements.
- Cycling: Use an automated battery cycler to perform repeated cycles (e.g., at a 1C or higher rate) under controlled temperature.
- Monitoring: Periodically (e.g., every 500 or 1000 cycles) interrupt the test to re-measure capacity and ESR.
- Endpoint Definition: The test is typically concluded when the device's capacity drops to 80% of its initial value or the ESR increases by a predefined percentage (e.g., 100%) [19] [24]. Research on advanced polymer dielectrics has demonstrated stability over 200,000 cycles [19].
Visualizing Material Design and Experimental Workflows
The development of next-generation capacitors, particularly for high-temperature applications, increasingly relies on advanced computational and experimental workflows. The following diagram illustrates a machine-learning-guided materials discovery process.
The Scientist's Toolkit: Essential Research Reagents and Materials
The following table catalogues key materials and reagents critical for the fabrication and testing of advanced capacitors, particularly in a research and development context.
Table 3: Essential Materials and Reagents for Capacitor Research
| Material/Reagent | Function in Research & Development | Typical Examples / Notes |
|---|---|---|
| High-Surface-Area Carbon | Primary electrode material for EDLCs; provides the substrate for double-layer formation. | Activated carbon, graphene, carbon nanotubes. The specific surface area and pore size distribution are critical parameters [22] [23]. |
| Metal Oxides | Active materials for pseudocapacitive charge storage via surface redox reactions. | Ruthenium oxide (RuO₂), Manganese oxide (MnO₂). Offer higher specific capacitance than carbon but often at higher cost and lower stability [22]. |
| Conducting Salts & Electrolytes | Medium for ion conduction between electrodes. The electrochemical window of the electrolyte defines the operating voltage of the device. | Tetraethylammonium tetrafluoroborate (TEA-BF₄) in acetonitrile, aqueous H₂SO₄ or KOH. Ionic liquids are used for higher voltage windows [22] [24]. |
| Polymer Matrix / Binder | Holds active electrode materials together and provides adhesion to the current collector. | Polyvinylidene fluoride (PVDF), Polytetrafluoroethylene (PTFE). Must be electrochemically inert in the operating window [19]. |
| Separator | Prevents physical contact and electrical shorting between the positive and negative electrodes while allowing ion transport. | Porous polypropylene (Celgard) or glass fiber membrane. Porosity and wettability are key characteristics [22]. |
| High-k Ceramic / Polymer Dielectrics | The insulating layer in dielectric capacitors; a higher dielectric constant (k) leads to higher capacitance. | Barium titanate (BaTiO₃) for ceramics; Biaxially oriented polypropylene (BOPP) for films. Recent research focuses on polymer composites with engineered fillers [19] [20]. |
| Machine Learning Models | Accelerates the discovery and optimization of new materials, such as predicting filler molecules to enhance dielectric properties. | Used as a computational tool to screen vast chemical spaces, as demonstrated in the design of high-temperature polymer composite capacitors [19]. |
The taxonomy of capacitor technologies reveals a clear performance spectrum, from the ultra-high power and speed of dielectric capacitors to the high energy density of batteries, with supercapacitors occupying a critical middle ground. Dielectric capacitors remain indispensable for applications requiring instantaneous power delivery and filtering, while supercapacitors excel in roles demanding high-power pulses and frequent cycling over thousands to hundreds of thousands of cycles.
The frontier of capacitor research is being pushed by hybrid approaches, such as lithium-ion and sodium-ion capacitors, which seek to optimize the trade-off between energy and power density [24]. Concurrently, the integration of machine learning into materials science is proving to be a transformative tool, enabling the rational design of novel dielectrics and electrode materials with targeted properties, as evidenced by the development of high-temperature polymer films with record energy density [19]. For researchers, the choice between dielectric and supercapacitor technologies, and their respective subtypes, must be guided by a fundamental understanding of their charge storage mechanisms and a careful analysis of the specific requirements for energy density, power density, cycle life, and operational environment.
The relentless pursuit of advanced energy storage technologies has positioned capacitors as critical components bridging the gap between conventional batteries and traditional capacitors. Capacitors are broadly classified into two mechanistic categories: electrochemical capacitors (including supercapacitors) that store charge via ion adsorption at electrode-electrolyte interfaces, and electrostatic capacitors that store energy through dielectric polarization. The energy density of any capacitor, quantified as the energy stored per unit volume or mass, is governed by the fundamental relationship E = ½ CV², where C represents capacitance and V denotes operational voltage. This equation reveals that energy density enhancement strategies must focus on maximizing both specific capacitance and operational voltage window. The materials forming the core components—electrodes for electrochemical capacitors and dielectrics for electrostatic capacitors, paired with their respective electrolytes—dictate these critical parameters through their intrinsic properties and synergistic interactions.
The selection of materials creates inherent trade-offs in capacitor performance profiles. Electrochemical capacitors, particularly supercapacitors, achieve high power density (exceeding 10,000 W kg⁻¹) and exceptional cycle life (over 1,000,000 cycles) but suffer from relatively low energy density (typically 5-30 Wh kg⁻¹) compared to batteries. In contrast, advanced electrostatic capacitors offer ultrahigh power density (approaching 10,000 kW kg⁻¹) but have historically exhibited even lower energy density. Research frontiers now focus on breaking these performance trade-offs through nanomaterial engineering, composite architectures, and interfacial control to achieve "dual high" characteristics—superior energy and power density simultaneously. The following sections provide a detailed comparison of material options, their performance impacts, and experimental methodologies for evaluating next-generation energy storage capacitors.
Comparative Performance of Capacitor Technologies
Table 1: Performance comparison of major capacitor types based on their material foundations
| Capacitor Type | Energy Density | Power Density | Cycle Life | Key Materials | Charge Storage Mechanism |
|---|---|---|---|---|---|
| Electrochemical Supercapacitors | |||||
| Electrochemical Double-Layer Capacitors (EDLC) | 5-10 Wh kg⁻¹ [27] | >10,000 W kg⁻¹ [4] | >1,000,000 [28] | Activated carbon, carbon nanotubes, graphene, organic electrolytes [4] | Non-faradaic ion adsorption at electrode-electrolyte interface [29] |
| Pseudocapacitors | 10-30 Wh kg⁻¹ (higher with hybrids) [4] | High (lower than EDLC) | 100,000+ [4] | Metal oxides (RuO₂, MnO₂), conducting polymers (PANI, PPy) [4] | Faradaic redox reactions with surface charge transfer [4] |
| Hybrid Capacitors | 30-115 Wh kg⁻¹ (up to 200 Wh kg⁻¹ in development) [30] [4] | High | 10,000-100,000 [4] | Carbon anodes, battery-type cathodes, organic/ionic liquid electrolytes [4] [27] | Combined EDLC and pseudocapacitive/battery-like mechanisms [4] |
| Electrostatic Capacitors | |||||
| Polymer Film Capacitors | ~0.1 Wh kg⁻¹ (BOPP) [27] | ~10,000 kW kg⁻¹ [27] | Virtually unlimited | Polypropylene, polyetherimide, polymer composites [31] [32] | Dielectric polarization [29] |
| Advanced Polymer Dielectrics | 8.3 J cm⁻³ at 200°C (~2.3 Wh kg⁻¹) [31] | Ultrahigh | Virtually unlimited | Polyimide, polynorbornene, fluorinated polymers [31] [32] | Dielectric polarization with high breakdown strength [31] |
| Ceramic Capacitors | <0.1 Wh kg⁻¹ | Ultrahigh | Virtually unlimited | Barium titanate, other ceramics [29] | Ferroelectric/paraelectric polarization [29] |
Table 2: Comparison of electrolyte systems for electrochemical capacitors
| Electrolyte Type | Voltage Window | Temperature Range | Ionic Conductivity | Key Characteristics | Applications |
|---|---|---|---|---|---|
| Aqueous | 1.0-1.8 V [4] | 0°C to 70°C (limited by freezing/boiling) [28] | High (>100 mS cm⁻¹) [27] | Low cost, non-flammable, environmentally friendly | Low-voltage applications, research settings |
| Organic | 2.5-2.8 V [4] | -40°C to 70°C [28] | Moderate (10-50 mS cm⁻¹) [27] | Higher energy density, volatile, potentially toxic | Commercial supercapacitors, consumer electronics |
| Ionic Liquids | 3.0-4.0 V [4] [27] | -50°C to 100°C+ [28] | Low to moderate (1-20 mS cm⁻¹) [28] | Non-volatile, high thermal stability, wide voltage window | High-temperature, high-voltage applications |
| Solid-State | 1.5-3.0 V [27] | -20°C to 100°C+ (polymer-dependent) | Low (10⁻⁵-10⁻³ S cm⁻¹) [27] | No leakage, flexible, enhanced safety | Flexible electronics, wearable devices |
Material Foundations and Property Relationships
Electrode Materials for Electrochemical Capacitors
Carbon-based materials dominate electrochemical double-layer capacitor (EDLC) applications due to their high surface area, electrical conductivity, and chemical stability. Activated carbons remain the commercial benchmark with specific surface areas of 1500-3000 m² g⁻¹, achieving specific capacitances of 100-150 F g⁻¹ in organic electrolytes. Graphene and its derivatives offer enhanced electrical conductivity and theoretically higher surface area (2630 m² g⁻¹), with specific capacitances reaching 150-200 F g⁻¹ in aqueous systems. Carbon nanotubes provide highly accessible mesoporous networks facilitating rapid ion transport, yielding power densities exceeding 20 kW kg⁻¹. Recent advancements include three-dimensional graphene nanoflakes synthesized via plasma-enhanced CVD, which demonstrate exceptional charge storage characteristics when integrated at 2.5 wt% in lithium-ion hybrid capacitors, achieving 115.58 Wh kg⁻¹ energy density [30].
Pseudocapacitive materials store charge through fast, reversible faradaic reactions at or near the electrode surface. Metal oxides such as ruthenium oxide (RuO₂) exhibit exceptionally high theoretical specific capacitance (1000-1500 F g⁻¹) but face cost and environmental limitations. Manganese oxide (MnO₂) offers an attractive alternative with theoretical capacitance of 1370 F g⁻¹, natural abundance, and environmental compatibility, though it suffers from poor electrical conductivity requiring composite architectures. Conducting polymers including polyaniline (PANI) and polypyrrole (PPy) store charge through reversible doping/dedoping processes, achieving capacitances of 200-500 F g⁻¹ while offering mechanical flexibility and tunable properties through chemical modification.
Emerging materials such as MXenes (transition metal carbides/nitrides) and metal-organic frameworks (MOFs) combine high electrical conductivity with tunable surface chemistry and hierarchical porosity. MXenes typically deliver capacitance values of 300-500 F g⁻¹ in aqueous electrolytes, while MOFs can be pyrolyzed to form conductive carbon networks with ultrahigh surface areas exceeding 4000 m² g⁻¹. Waste-derived carbons have gained attention for sustainable supercapacitor development, converting biomass precursors into porous carbons with specific capacitances comparable to synthetic materials at reduced cost and environmental impact [4].
Dielectric Materials for Electrostatic Capacitors
Commercial polymer dielectrics like biaxially oriented polypropylene (BOPP) dominate the capacitor market due to exceptional dielectric strength (>600 V μm⁻¹) and low loss, but are limited by low dielectric constant (εr ≈ 2.2) and poor thermal stability above 85°C. High-temperature polymers including polyimide (Kapton), polyetherimide (PEI), and polyether ether ketone (PEEK) offer glass transition temperatures exceeding 200°C but typically exhibit lower dielectric constants (3.0-3.5) and reduced breakdown strength at elevated temperatures [31].
Advanced polymer composites incorporate ceramic or carbon-based nanofillers to enhance dielectric constant while maintaining breakdown strength. Perovskite ceramics like barium titanate (BaTiO₃, εr ≈ 1000-5000) embedded in polymer matrices can increase composite dielectric constants to 20-50 at 10-30 vol% loading. Near the percolation threshold (typically 15-20 vol% for conductive fillers), composites can achieve extreme dielectric constants exceeding 500, though this approach risks increased conductivity and dielectric loss [33]. Core-shell nanostructures with conductive cores and insulating shells can mitigate this issue by creating internal microcapacitors within the dielectric matrix.
Molecular engineering approaches have recently demonstrated remarkable success in enhancing high-temperature dielectric performance. Fluorinated polyetherimides incorporating bulky -CF₃ substituents simultaneously increase bandgap and glass transition temperature by disrupting conjugation in biphenyl structures, achieving discharge energy densities of 5.3 J cm⁻³ with 90.4% efficiency at 200°C [32]. AI-assisted discovery has identified previously unknown polynorbornene dielectrics (PONB-2Me5Cl) exhibiting exceptional energy densities of 8.3 J cm⁻³ at 200°C, approximately 11 times greater than commercially available polymer dielectrics at this temperature [31].
Electrolyte Systems
The electrolyte serves as the ionic charge transport medium in electrochemical capacitors and significantly influences operating voltage, temperature range, and rate capability. Aqueous electrolytes (e.g., H₂SO₄, KOH) offer high ionic conductivity (>1 S cm⁻¹) and environmental friendliness but are limited by narrow voltage windows (~1.2 V) determined by water electrolysis. Recent developments in "water-in-salt" electrolytes have expanded this window to approximately 2.5-3.0 V through formation of protective interphases on electrodes [28].
Organic electrolytes (typically tetraalkylammonium salts in acetonitrile or propylene carbonate) enable higher operating voltages (2.5-2.8 V) but exhibit lower ionic conductivity (10-50 mS cm⁻¹) and increased toxicity. Ionic liquids offer the widest electrochemical stability windows (3.0-4.0 V) and thermal stability up to 300-400°C, though their high viscosity results in reduced power capability, particularly at low temperatures [27].
Low-temperature electrolyte design must balance multiple competing parameters: freezing point depression, ionic conductivity, viscosity, and electrochemical stability. Strategies include formulating eutectic solvent mixtures, using low-viscosity co-solvents, and selecting salts with low dissociation energies. At temperatures below -40°C, ion aggregation and salt precipitation become significant challenges, requiring careful optimization of salt concentration and solvent composition [28].
Experimental Protocols and Methodologies
Three-Electrode Cell Testing for Electrode Materials
The electrochemical performance of individual electrode materials is typically evaluated in three-electrode cells, isolating the working electrode behavior from counter electrode effects. The standard protocol involves:
Electrode Fabrication: Active materials (80-90 wt%), conductive additives (5-10 wt% carbon black), and binders (5-10 wt% PVDF or PTFE) are mixed with appropriate solvents to form homogeneous slurries. These are coated onto current collectors (typically aluminum or stainless steel) and dried under vacuum at 80-120°C for 12-24 hours. Mass loading is carefully controlled (typically 2-5 mg cm⁻² for fundamental studies) to minimize transport limitations.
Cell Assembly: A standard three-electrode configuration includes the working electrode, platinum or graphite counter electrode, and stable reference electrode (Ag/AgCl for aqueous systems, Ag/Ag⁺ for non-aqueous). Electrolyte selection matches the intended application environment, with degassing performed to remove dissolved oxygen.
Cyclic Voltammetry (CV): Performed at scan rates from 0.1 mV s⁻¹ to 1 V s⁻¹ to characterize charge storage mechanisms. EDLC materials exhibit rectangular CV shapes, while pseudocapacitive materials show distinct redox peaks. The specific capacitance is calculated from CV data using C = (∫IdV)/(2vΔV), where I is current, v is scan rate, and ΔV is voltage window.
Galvanostatic Charge-Discharge (GCD): Conducted at current densities ranging from 0.1 A g⁻¹ to 20 A g⁻¹. The specific capacitance is calculated from discharge curves using C = (IΔt)/(mΔV), where I is current, Δt is discharge time, m is active mass, and ΔV is voltage change excluding IR drop.
Electrochemical Impedance Spectroscopy (EIS): Performed from 100 kHz to 10 mHz with 5-10 mV amplitude. Data fitted to equivalent circuit models to extract series resistance, charge transfer resistance, and Warburg diffusion elements. The frequency response analysis provides insights into capacitive versus diffusive contributions.
Two-Electrode Device Testing
Full capacitor devices are assembled in symmetric or asymmetric configurations and tested under conditions reflecting real applications:
Device Assembly: Electrodes are typically separated by porous membranes (glass fiber, polypropylene) in Swagelok or coin-cell configurations. Precise control of electrode balancing (mass ratio, capacitance matching) is critical, particularly for hybrid systems. Electrolyte filling occurs in an argon-filled glovebox for oxygen- and moisture-sensitive systems.
Cyclic Stability Testing: Performed over thousands to millions of cycles at elevated temperature (50-70°C) to accelerate aging. Capacitance retention (>80% after 10,000 cycles is typically targeted) and coulombic efficiency (>95-99%) are monitored. Post-mortem analysis including SEM, XRD, and XPS helps identify degradation mechanisms.
Leakage Current and Self-Discharge: Measured by holding at maximum voltage for several hours and monitoring current decay, followed by open-circuit voltage monitoring over 2-48 hours. These parameters critically impact long-term energy retention in practical applications.
Temperature-Dependent Performance: Characterized from -50°C to 100°C using environmental chambers. Low-temperature performance is limited by electrolyte freezing and increased viscosity, while high-temperature operation accelerates degradation mechanisms including electrolyte decomposition and electrode corrosion.
Dielectric Material Characterization
The energy storage performance of dielectric materials for electrostatic capacitors is evaluated through distinct methodologies:
Film Preparation: Polymer dielectrics are processed into thin films (1-20 μm thickness) via solution casting, melt pressing, or spin coating. Thickness uniformity is critically important for reproducible breakdown strength measurements.
Dielectric Spectroscopy: Measures permittivity and loss tangent over broad frequency (10⁻²-10⁶ Hz) and temperature ranges (-150°C to 300°C). The dielectric constant is calculated from capacitance measurements using εr = (C·d)/(ε₀·A), where d is thickness and A is electrode area.
Breakdown Strength Testing: Employing a ramp voltage method (typically 100-500 V s⁻¹) with at least 10-15 replicates per sample to establish Weibull statistical distribution. Breakdown strength decreases with increasing temperature and film thickness following an inverse power law relationship.
Polarization-Depolarization Current (PDC): Characterizes conduction mechanisms and charge trapping behavior. High-temperature insulation resistance is particularly important for identifying materials suitable for elevated temperature operation.
Discharge Energy Density Measurement: Determined by integrating the discharge current from bipolar pulse tests, or calculated from Ue = ∫EdD, where E is electric field and D is electric displacement. Charge-discharge efficiency is calculated as the ratio of discharged to charged energy.
Research Reagents and Materials Toolkit
Table 3: Essential research reagents and materials for capacitor development
| Material Category | Specific Examples | Key Functions | Research Considerations |
|---|---|---|---|
| Carbon Electrodes | Activated carbon (YP-50F, BP2000), graphene oxide, carbon nanotubes, carbon black | Electrical conductivity, double-layer capacitance, scaffold for composites | Surface area, pore size distribution, surface functionalization, dispersion stability |
| Pseudocapacitive Materials | RuO₂, MnO₂, NiO, V₂O₅, PANI, PPy, PEDOT:PSS | Faradaic charge storage, enhanced specific capacitance | Crystallinity, oxidation state, electrical conductivity, cycling stability |
| Binders & Additives | PVDF, PTFE, Na-CMC, carbon black, Super P | Electrode integrity, electrical connectivity, flexibility | Solubility, thermal stability, electrochemical stability, adhesion properties |
| Aqueous Electrolytes | H₂SO₄, KOH, Na₂SO₄, Li₂SO₄ | Ion conduction, cost-effectiveness, safety | Concentration, pH, corrosion behavior, temperature range |
| Organic Electrolytes | TEABF₄ in ACN, TEABF₄ in PC, EMIMBF₄ | Higher voltage operation, wider temperature range | Purity, water content, viscosity, toxicity, decomposition voltage |
| Separators | Glass fiber, Celgard, Whatman, nylon membranes | Ion transport, electronic insulation, mechanical support | Porosity, wettability, thickness, thermal stability |
| Dielectric Polymers | Polypropylene, polyimide, polyetherimide, PVDF | Electric field sustainment, polarization, insulation | Dielectric constant, loss tangent, breakdown strength, thermal stability |
| Nanoparticle Fillers | BaTiO₃, TiO₂, SiO₂, graphene, carbon black | Enhanced dielectric constant, tailored properties | Particle size, surface chemistry, dispersion, percolation threshold |
Charge Storage Mechanisms and Material Interactions
The fundamental charge storage mechanisms in capacitors dictate material selection strategies and ultimate performance characteristics. Electrochemical capacitors rely on physical ion adsorption (EDLC) and/or surface redox reactions (pseudocapacitance) at the electrode-electrolyte interface. EDLC mechanisms dominate in carbon-based materials with high specific surface area, where the capacitance scales directly with electrochemically accessible surface area. The energy storage occurs via reversible ion adsorption in the electrical double-layer, with charge separation distances on the angstrom scale leading to exceptionally high capacitance density. Pseudocapacitive materials undergo fast, reversible faradaic reactions at the surface or near-surface region, producing capacitance that is additive to the double-layer contribution. These mechanisms include underpotential deposition, redox pseudocapacitance, and intercalation pseudocapacitance, each with distinct electrochemical signatures and material requirements [4].
In contrast, electrostatic capacitors store energy through dielectric polarization mechanisms in insulating materials. Electronic polarization occurs at the atomic scale through electron cloud distortion, while ionic polarization involves displacement of cations and anions in opposite directions. Oriental polarization arises from the alignment of permanent molecular dipoles with the applied electric field. Space charge polarization occurs at interfaces and boundaries in heterogeneous materials. Each mechanism contributes to the overall dielectric constant, with different characteristic response times and temperature dependencies. Ferroelectric materials exhibit spontaneous polarization that can be reoriented by an external electric field, providing exceptionally high dielectric constants but often accompanied by hysteresis losses that reduce charge-discharge efficiency [29].
The interaction between materials and their operational environment creates complex performance trade-offs. In electrochemical capacitors, the matching of electrolyte ion size with electrode pore size distribution critically influences capacitance, with optimal performance occurring when pore sizes slightly exceed solvated ion dimensions. In electrostatic capacitors, the breakdown strength typically decreases with increasing dielectric constant, creating fundamental materials selection challenges. Recent approaches using multilayer architectures with alternating high-breakdown-strength and high-dielectric-constant layers have demonstrated promising pathways to overcome these limitations [32].
Emerging Trends and Research Frontiers
The capacitor materials landscape is evolving rapidly across multiple research fronts. Hybrid capacitor systems are blurring the traditional boundaries between capacitors and batteries, with lithium-ion capacitors now achieving energy densities of 115 Wh kg⁻¹ while maintaining power densities exceeding 10 kW kg⁻¹ [30]. These devices combine battery-type electrodes with capacitor-type electrodes, leveraging the advantages of both storage mechanisms. Similarly, zinc-ion hybrid capacitors are emerging as safe, low-cost alternatives for large-scale energy storage.
AI-accelerated materials discovery is dramatically reducing development timelines for advanced dielectrics. The polyVERSE (polymers designed by Virtually-Executed Rule-Based Synthesis Experiments) platform has demonstrated the ability to identify previously unknown polymer dielectrics with exceptional performance, such as PONB-2Me5Cl which exhibits 8.3 J cm⁻³ at 200°C [31]. These approaches leverage graph neural networks to predict material properties from chemical structure, enabling rapid screening of vast chemical spaces before resource-intensive synthesis and testing.
Multifunctional capacitor materials are enabling new application paradigms. Structural supercapacitors that simultaneously store energy and bear mechanical load are being developed for electric vehicle and aerospace applications, using carbon fiber electrodes and polymer electrolytes with enhanced mechanical properties. Similarly, flexible and stretchable capacitors are emerging for wearable electronics, requiring materials that maintain performance under mechanical deformation.
Extreme-environment capacitors represent another frontier, with recent advances in both high-temperature and low-temperature operation. Fluorinated polyetherimides with bulky -CF₃ substituents maintain 5.3 J cm⁻³ energy density at 200°C with 90.4% efficiency [32], while advanced electrolyte formulations using eutectic mixtures and ionic liquids enable operation down to -70°C [28]. These developments are expanding capacitor applications into automotive, aerospace, and polar research environments where temperature extremes were previously prohibitive.
In the development of advanced capacitors, particularly supercapacitors, researchers and engineers navigate a complex performance landscape defined by three critical parameters: energy density, power density, and cycle life. These metrics exhibit strong trade-off relationships that fundamentally constrain device design and application suitability [34]. Energy density (Wh/kg or Wh/L) determines the total amount of energy a device can store, while power density (W/kg or W/L) defines how quickly that energy can be delivered or absorbed. Cycle life represents the number of charge-discharge cycles a device can endure before significant performance degradation occurs [35].
Understanding these trade-offs is essential for matching capacitor technologies to specific application requirements, from rapid burst-power applications to those requiring longer-term energy sustainability. This guide provides a structured comparison of these fundamental trade-offs across capacitor technologies, supported by experimental data and standardized testing methodologies relevant to research and development contexts.
Performance Comparison of Energy Storage Technologies
Quantitative Comparison of Key Metrics
Table 1: Performance metrics of capacitors, supercapacitors, and batteries
| Technology | Energy Density (Wh/L) | Power Density (W/L) | Cycle Life (cycles) | Efficiency (%) | Key Characteristics |
|---|---|---|---|---|---|
| Traditional Capacitors | <0.1 | Very High (up to 10^6) | >1,000,000 | >95 | Extremely fast charge/discharge, low energy storage |
| Supercapacitors (EDLC) | 1-10 [35] | High (~10,000) [34] | >100,000 [35] | 90-98 [35] [36] | Electrostatic storage, excellent cycle life |
| Pseudocapacitors | Moderate (Higher than EDLC) [37] | Moderate (Lower than EDLC) [37] | 10,000-100,000 [37] | 85-95 | Faradaic reactions, moderate energy/power balance |
| Hybrid Supercapacitors | Moderate-High (10-50% of Li-ion) [37] [34] | Moderate [37] | 10,000-100,000 [37] | 85-95 | Combined battery and capacitor electrodes |
| Lithium-ion Batteries | 200-650 [35] | Moderate (~1,000) [36] | 1,000-10,000 [35] [36] | 80-90 [35] | High energy density, limited power and cycle life |
Table 2: Supercapacitor subtypes and their trade-off profiles
| Supercapacitor Type | Charge Storage Mechanism | Energy Density | Power Density | Cycle Life | Technology Maturity |
|---|---|---|---|---|---|
| Electric Double-Layer Capacitors (EDLC) | Electrostatic (non-Faradaic) [34] | Low [37] | High [37] | Very High (>100,000) [37] | Mature [37] |
| Pseudocapacitors | Electrochemical (Faradaic) [34] | Moderate [37] | Moderate [37] | Moderate (Lower than EDLC) [37] | Early Development [37] |
| Hybrid Supercapacitors | Combined electrostatic & electrochemical [34] | High (for supercapacitors) [37] | Moderate [37] | Moderate-High [37] | Commercialization Phase [37] |
Analysis of Trade-off Relationships
The performance data reveals several fundamental trade-off relationships. First, a strong inverse correlation exists between energy density and power density – technologies optimized for high energy storage typically sacrifice power delivery capability, and vice versa [34]. Second, cycle life is inversely related to the depth of electrochemical processes – primarily electrostatic charge storage mechanisms (EDLCs) achieve significantly higher cycle life than those relying on Faradaic reactions (pseudocapacitors and batteries) [35].
Hybrid approaches attempt to balance these trade-offs by combining electric double-layer capacitance with battery-like Faradaic processes. Research demonstrates that hybrid capacitors with redox additives can operate in either "capacitor-like" or "battery-like" regimes depending on current density and additive concentration, enabling some tuning of these fundamental relationships [15].
Experimental Protocols for Performance Characterization
Standardized Testing Methodologies
Energy and Power Density Measurement Protocol
Objective: Quantify energy density, power density, and efficiency under standardized conditions.
Materials and Equipment:
- Potentiostat/Galvanostat with impedance capability
- Constant temperature chamber (20°C ± 2°C)
- Precision balance (0.1 mg accuracy)
- Device holder with calibrated pressure application
Procedure:
- Device Preparation: Condition cells through 5 formation cycles at C/10 rate
- Constant Power Discharge Test:
- Charge to rated voltage at constant current (1C rate)
- Apply constant power discharge across decade range (10 W/kg to 10,000 W/kg)
- Record voltage versus time until cutoff voltage (50% of rated voltage)
- Energy Calculation: Integrate power × time curve during discharge
- Ragone Plot Construction: Plot energy density versus power density on logarithmic axes
- Efficiency Determination: Calculate round-trip efficiency from charge-discharge energy ratio
This methodology aligns with international standards including IEC 62391-2 and allows direct comparison between different energy storage technologies.
Cycle Life Testing Protocol
Objective: Determine capacity retention and impedance growth over extended cycling.
Procedure:
- Baseline Measurement: Record initial capacitance and ESR using EIS at 1 kHz
- Accelerated Cycling:
- Apply symmetrical charge-discharge cycles at rated voltage
- Use current corresponding to 5C rate (12-minute cycle time)
- Maintain temperature at 25°C ± 3°C with active cooling
- Periodic Checkpoints:
- Every 1,000 cycles: Perform full characterization (capacitance, ESR, self-discharge)
- Every 10,000 cycles: Perform destructive analysis on sample cells
- Failure Criteria: Define end of life as 20% capacitance fade or 100% ESR increase
- Post-Mortem Analysis: Examine electrode morphology, electrolyte decomposition
For pseudocapacitors and hybrid systems, note that Coulombic efficiency may require a certain number of cycles to stabilize due to redox additive activation processes [15].
Specialized Methodologies for Advanced Capacitors
Frequency Domain Analysis for Supercapacitors
Objective: Characterize dynamic behavior across frequency spectrum for power-oriented applications.
Procedure:
- Electrochemical Impedance Spectroscopy (EIS):
- Apply frequency sweep from 10 mHz to 10 kHz
- Use AC amplitude of 10 mV around DC bias points from 0 V to rated voltage
- Record impedance magnitude and phase angle
- Parameter Extraction:
- Fit data to equivalent circuit model (e.g., 6-element RLC model)
- Extract capacitance versus frequency relationship
- Identify inductive behavior crossover frequency (>1 kHz for most devices) [38]
- Frequency-Dependent Performance:
- Calculate available energy at different frequency bands
- Model power capability under high-frequency operation
This methodology is particularly valuable for applications where supercapacitors interface with power electronics, such as in frequency regulation for renewable energy systems [38].
Visualization of Performance Relationships
Trade-off Relationships Diagram
Experimental Characterization Workflow
Research Reagent Solutions for Capacitor Evaluation
Table 3: Essential research materials for capacitor performance evaluation
| Category | Specific Materials/Equipment | Research Function | Key Characteristics |
|---|---|---|---|
| Electrode Materials | Activated carbon, Carbon nanotubes, Graphene, MXenes [34] | Electric double-layer formation | High surface area, electrical conductivity, electrochemical stability |
| Pseudocapacitive Materials | Transition metal oxides (RuO₂, MnO₂), Conducting polymers [34] | Faradaic charge storage | Multiple oxidation states, proton intercalation capability |
| Electrolytes | Organic electrolytes, Aqueous electrolytes, Ionic liquids, Solid-state electrolytes [34] | Ion transport medium | Wide voltage window, high ionic conductivity, temperature stability |
| Redox Additives | Hydroquinone, other quinone derivatives [15] | Enhance energy density via Faradaic reactions | Reversible redox activity, electrolyte compatibility |
| Characterization Equipment | Potentiostat/Galvanostat with EIS, Constant temperature chamber, BET surface area analyzer | Performance quantification | Precision measurement, environmental control, material characterization |
The critical trade-offs between energy density, power density, and cycle life present fundamental constraints in capacitor development that researchers must navigate through material selection and device architecture. Electric double-layer capacitors maintain superiority in applications requiring high power density and extreme cycle life, while pseudocapacitive and hybrid approaches sacrifice some cycle life for enhanced energy storage capability [37] [34].
Future research directions should focus on breaking these traditional trade-off relationships through novel materials approaches, including the development of composite electrodes that combine double-layer and pseudocapacitive materials, advanced electrolytes with wider voltage windows, and architectural designs that optimize ion transport pathways. The standardization of testing protocols, as outlined in this guide, will enable more direct comparison between emerging technologies and accelerate the development of optimized energy storage solutions for specific application requirements.
For researchers focusing on capacitor energy density, the most promising pathways appear to be in hybrid systems that carefully balance capacitive and battery-like charge storage mechanisms, potentially with optimized redox additives that minimize the cycle life penalty typically associated with increased energy density [15].
Measurement Protocols and Application-Specific Performance Requirements
The accurate evaluation of energy storage density is a critical challenge in the development of advanced dielectric capacitors for high-power applications. Inconsistencies in existing evaluation approaches have created an urgent need for standardized protocols to ensure reliable benchmarking of new materials and devices [39]. This guide provides a comparative analysis of prominent measurement techniques, focusing on the experimental validation of hysteresis loop integration and UI curve analysis as reliable methods.
Dielectric capacitors, including relaxor ferroelectric (RFE) and antiferroelectric (AFE) types, play pivotal roles in pulsed power systems, electric vehicles, and advanced electronics due to their exceptional power density and rapid charge-discharge capabilities [39] [40]. However, significant discrepancies in reported energy density values persist across research literature, complicating direct comparison between material systems. For instance, studies on NaNbO3 systems have reported 14.1 J/cm³ via hysteresis-derived measurement but only 5.94 J/cm³ using discharge current methods [39]. This variability underscores the necessity for methodological standardization aligned with operational requirements and material properties.
Comparative Analysis of Measurement Techniques
Five characterization techniques are currently employed for evaluating capacitor energy density, each with distinct principles, advantages, and limitations [39]:
- Method A: Hysteresis Loop Integration - Calculates energy density using charge (Q), voltage (U), and capacitor volume through direct polarization measurements
- Method B: Discharge Current Method - Derives results from capacitance (C) obtained via RLC circuit discharge profiles
- Method C: Equivalent Capacitance Method - Uses DC-bias-dependent capacitance within a similar framework to Method B
- Method D: UI Integration - Incorporates time-resolved voltage with current (I) and time (t) data
- Method E: Resistive Consumption - Quantifies energy losses through resistance (R) measurements
Performance Comparison Table
Table 1: Systematic comparison of energy density measurement methods for dielectric capacitors
| Method | Technical Principle | Reported Accuracy | Key Advantages | Inherent Limitations |
|---|---|---|---|---|
| Hysteresis Loop Integration | Polarization-electric field (P-E) relationship integration | High (Validated benchmark) | Direct measurement, reliable for nonlinear dielectrics | Requires specialized equipment for polarization measurement |
| UI Curve Integration | Time-resolved voltage and current data integration | High (Superior consistency) | Practical implementation, accounts for dynamic losses | Complex data acquisition and processing |
| Discharge Current Method | RLC circuit discharge profile analysis | Low (Systematic overestimation) | Simple experimental setup | Unaccounted energy losses inflate results |
| Equivalent Capacitance | DC-bias-dependent capacitance measurement | Low (Systematic underestimation) | Straightforward calculation | Fails to capture nonlinear dielectric behavior |
| Resistive Consumption | Energy loss quantification through resistance | Medium (Good consistency) | Effective for loss characterization | Indirect energy density measurement |
Experimental Validation Findings
Comparative experimental analyses reveal that while hysteresis loop integration provides reliable benchmarking, discharge current methods tend to overestimate energy density due to unaccounted losses. Conversely, equivalent capacitance measurements typically underestimate high-voltage performance. UI curve integration and resistive energy consumption methods exhibit superior consistency for practical implementation scenarios [39].
For relaxor ferroelectric capacitors, hysteresis loop integration remains the gold standard, particularly for materials exhibiting significant nonlinear behavior. The delayed polarization saturation in relaxor ferroelectrics, combined with high breakdown strength, makes this method particularly suitable for obtaining accurate recoverable energy density measurements [41].
Detailed Experimental Protocols
Hysteresis Loop Integration Methodology
Procedure
The hysteresis loop integration method requires obtaining polarization-electric field (P-E) hysteresis loops under controlled conditions [39] [41]:
Sample Preparation: Fabricate capacitor structures with appropriate electrode materials. For thin-film capacitors, ensure uniform thickness (typically 200-500 nm) and eliminate defects that could cause premature breakdown [41].
Measurement Setup: Apply a bipolar electric field across the capacitor using a standardized ferroelectric tester or precision high-voltage source measurement unit. The electric field should be swept at a controlled rate (typically 1-10 kHz) to capture the complete hysteresis behavior [41].
Data Collection: Record the polarization response (P) as a function of the applied electric field (E) up to the maximum operational field or just below the breakdown strength.
Calculation: Determine the recoverable energy density (Wrec) using the integral: ( W{\text{rec}} = \int{Pr}^{P{\text{max}}} E \, dP ) where Pmax is the maximum polarization at the applied electric field and Pr is the remnant polarization at zero field [41].
Efficiency Calculation: Compute the efficiency (η) using: ( \eta = \left( \frac{W{\text{rec}}}{W{\text{rec}} + W_{\text{loss}}} \right) \times 100\% ) where Wloss represents the energy dissipated during the charging-discharging cycle, corresponding to the area enclosed by the hysteresis loop [41].
Workflow Visualization
Diagram 1: Hysteresis loop integration methodology workflow for capacitor energy density measurement
UI Curve Integration Methodology
Procedure
The UI integration method focuses on time-resolved electrical measurements during charge and discharge cycles [39]:
Circuit Configuration: Implement a standardized RLC circuit with precise current and voltage monitoring capabilities. Include appropriate current shunts and voltage probes with high bandwidth.
Signal Application: Apply a controlled charge pulse to the capacitor, followed by a discharge period through a characterized load resistance.
Data Acquisition: Simultaneously record voltage (U) and current (I) waveforms at high sampling rates (typically 1 MS/s or higher) during the discharge phase. Ensure precise time synchronization between voltage and current channels.
Time Integration: Calculate the recoverable energy density using the integral: ( W_{\text{rec}} = \frac{1}{V} \int U(t) I(t) \, dt ) where V is the volume of the capacitor, U(t) is the time-dependent voltage, and I(t) is the time-dependent current.
Validation: Compare results with hysteresis loop integration data for consistency. For RFE and AFE capacitors, UI integration should show strong correlation with hysteresis-derived values when properly implemented.
Workflow Visualization
Diagram 2: UI curve integration methodology workflow for practical capacitor energy assessment
Essential Research Reagent Solutions
Table 2: Key research materials and equipment for capacitor energy density measurements
| Category | Specific Items | Function & Application | Technical Specifications |
|---|---|---|---|
| Capacitor Materials | Relaxor Ferroelectric (RFE) ceramics (e.g., BNT-BMN) | High breakdown field, energy storage efficiency | Lead-free compositions, ~200 nm thickness [41] |
| Antiferroelectric (AFE) ceramics | Reversible phase transitions, near-zero remanent polarization | NaNbO3 systems, reversible antiferroelectric-ferroelectric switching [39] | |
| Electrode Systems | Sintered aluminum powder anodes | Increased specific surface area for enhanced capacity | 11% higher capacity density vs. conventional etched Al [42] |
| SnO2/AlPO4/AAO interface | High breakdown field strength (5.4 MV/cm) | Inhibits Sn diffusion, prevents local breakdown [42] | |
| Characterization Tools | Ferroelectric Test System | P-E hysteresis loop measurement | Bipolar voltage capability, high-voltage options |
| Precision Source Measure Unit | UI curve data acquisition | High sampling rate (>1 MS/s), synchronized channels | |
| Atomic Layer Deposition System | MIM capacitor fabrication | High-precision electrode deposition [42] |
Method Selection Guidelines
Application-Specific Recommendations
The optimal measurement technique depends on material properties, operational requirements, and application context:
Material Development Research: Hysteresis loop integration provides the most reliable benchmark for novel material characterization, particularly for nonlinear dielectrics like relaxor ferroelectrics [39] [41].
Practical Implementation Validation: UI curve integration offers superior consistency for real-world performance assessment, especially when evaluating capacitors for pulsed power applications [39].
Quality Control Applications: Equivalent capacitance methods may suffice for rapid screening despite underestimation tendencies, provided consistent calibration is maintained.
Loss Mechanism Analysis: Resistive consumption methods effectively quantify energy dissipation and thermal management requirements [39].
Emerging Standardization Framework
The establishment of unified testing protocols is essential for resolving inconsistencies in energy density reporting. Key considerations include:
- Voltage Scaling: Account for nonlinear dielectric behavior across different electric field strengths
- Frequency Dependence: Standardize testing frequencies (typically 1-10 kHz) for comparative analysis
- Temperature Stability: Evaluate performance across operational temperature ranges
- Cycling Endurance: Assess property evolution through accelerated lifecycle testing
Recent advances in lead-free relaxor ferroelectric thin films achieving 61 J/cm³ energy density with 70% efficiency through optimized processing demonstrate the critical importance of standardized measurement for valid performance comparisons [41].
Hysteresis loop integration remains the validated benchmark for dielectric capacitor energy density assessment, while UI curve analysis provides complementary practical implementation data with superior consistency. The discharge current method systematically overestimates performance, while the equivalent capacitance approach tends toward underestimation, particularly for nonlinear dielectric materials.
Standardized application of these measurement techniques, aligned with specific material properties and operational requirements, enables precise energy density quantification essential for advancing dielectric capacitor technology. Future methodological developments should focus on harmonizing testing protocols across research institutions to facilitate direct comparison of emerging materials and accelerate innovation in high-power energy storage systems.
Electrochemical characterization techniques are fundamental tools for evaluating the performance, mechanisms, and limitations of energy storage materials and devices. Within the context of supercapacitor research, particularly for evaluating energy density, two methods stand as pillars of electrochemical analysis: constant-current charge/discharge (CCCD) and cyclic voltammetry (CV). These techniques provide complementary insights into how capacitors store and release energy, how efficiently they operate over numerous cycles, and what underlying electrochemical processes govern their performance. For researchers focused on bridging the performance gap between conventional capacitors and batteries, understanding the nuanced data provided by these techniques is essential for material selection and device optimization [4] [11].
The selection of an appropriate characterization method directly influences the accuracy of performance parameters such as specific capacitance, energy density, cycle life, and charge retention. While CCCD testing provides straightforward quantification of these parameters through time-domain analysis, CV offers a more nuanced view of charge storage mechanisms and kinetic properties through potential-domain sweeps. This guide provides a detailed comparison of both techniques, outlining their theoretical bases, experimental protocols, data interpretation methods, and respective advantages for specific research applications within energy storage development [43] [44].
Constant-Current Charge/Discharge Characterization
Fundamental Principles and Applications
Constant-current charge/discharge is a chronopotentiometric technique where a fixed current is applied to the supercapacitor, and the voltage response is measured over time. The methodology is widely used for determining fundamental performance parameters, including specific capacitance, energy density, power density, and cycle life. During charging, voltage increases linearly if the system exhibits ideal capacitive behavior, while discharging follows a similar linear decrease. The simplicity of this method makes it particularly valuable for quantifying the long-term stability of supercapacitors, as thousands of charge/discharge cycles can be performed to assess performance degradation [43] [45].
Recent research has revealed nuanced aspects of CCCD testing. A 2023 study demonstrated that constant-current charging/discharging is marginally more efficient (typically by less than 1%) than constant-power charging under equal boundary conditions (same voltage range and time duration). This finding has practical implications for optimizing charging strategies in DC microgrid applications where supercapacitors serve as energy storage buffers. The efficiency advantage stems from reduced energy losses during the current delivery process, though the small magnitude of difference means both approaches remain viable for most applications [43] [46].
Experimental Protocol and Data Analysis
Standard Experimental Procedure:
- Cell Configuration: Assemble supercapacitor test cells with appropriate electrodes, separator, and electrolyte. Common configurations include symmetric cells using identical electrodes or asymmetric designs combining different electrode materials [4] [47].
- Current Density Selection: Determine appropriate current densities based on the active material mass and expected capacitance. Typical ranges vary from 0.1 A g⁻¹ to 10 A g⁻¹ for power density assessments [48].
- Voltage Window Setting: Define the operational voltage window based on electrolyte stability (e.g., 0-1 V for aqueous electrolytes, 0-2.7 V for organic electrolytes) [47] [45].
- Cycle Programming: Program the potentiostat/galvanostat to apply charge and discharge sequences with potential limits. Include rest periods if studying relaxation phenomena [45].
- Data Collection: Record voltage versus time throughout the cycling process. Monitor temperature if assessing thermal effects [43] [45].
- Post-Test Analysis: Calculate key parameters from the discharge curve using established formulas.
Key Calculations:
- Specific Capacitance (Cₛ): Calculated from the discharge curve using ( C = \frac{I \cdot \Delta t}{m \cdot \Delta V} ), where I is discharge current, Δt is discharge time, m is active mass, and ΔV is voltage window [4] [48].
- Energy Density (E): Derived using ( E = \frac{1}{2} C \cdot V^2 ), where C is specific capacitance and V is operating voltage [4] [11].
- Power Density (P): Calculated using ( P = \frac{E}{\Delta t} ), where E is energy density and Δt is discharge time [11] [48].
- Coulombic Efficiency: Determined from the ratio of discharge time to charge time over multiple cycles [47] [45].
Figure 1: Constant-Current Charge/Discharge Experimental Workflow
Cyclic Voltammetry Characterization
Fundamental Principles and Applications
Cyclic voltammetry is a potentiodynamic technique that measures current response while cycling the potential between defined limits at a controlled rate. The resulting current-voltage plots provide critical insights into charge storage mechanisms, distinguishing between electrical double-layer capacitance (EDLC) and pseudocapacitance. EDLC typically produces rectangular-shaped CV curves, indicating non-faradaic charge storage through electrostatic ion adsorption at the electrode-electrolyte interface. In contrast, pseudocapacitance exhibits distinct redox peaks in the CV profile, representing faradaic charge transfer through surface or near-surface redox reactions without phase transformation [44] [11].
Advanced CV modeling has enabled more precise analysis of hybrid systems. A 2025 innovative theoretical model effectively captures the combination of EDLC and pseudocapacitance mechanisms within a single CV curve, exhibiting both the rectangular current profile of EDLC and the distinctive peaks of redox activity. This modeling approach introduces dynamic weight ratios to account for non-ideal behavior and leakage phenomena, significantly enhancing the interpretation of complex electrochemical systems. Such developments are particularly valuable for analyzing next-generation hybrid supercapacitors that combine carbon materials with redox-active compounds to enhance both energy and power density [44].
Experimental Protocol and Data Analysis
Standard Experimental Procedure:
- Cell Setup: Prepare electrochemical cell with working, counter, and reference electrodes in selected electrolyte [44].
- Potential Window Determination: Establish the stable electrochemical window through initial scans to avoid decomposition reactions [44] [11].
- Scan Rate Selection: Perform tests at multiple scan rates (typically 1-100 mV s⁻¹) to probe kinetic limitations [44].
- Cycle Programming: Program voltage cycles between upper and lower limits, with options for multiple cycles to assess stability [44].
- Data Collection: Measure current response as a function of applied potential throughout the cycling process [44].
- Post-Test Analysis: Calculate capacitance from integrated current and assess redox behavior from peak characteristics.
Key Calculations:
- Specific Capacitance (Cₛ): Calculated by integrating the CV curve area using ( C = \frac{1}{m \cdot \nu \cdot \Delta V} \int IdV ), where m is active mass, ν is scan rate, ΔV is voltage window, and I is current [44] [4].
- Peak Separation Analysis: The voltage difference between anodic and cathodic peaks indicates reaction reversibility, with smaller separations suggesting more efficient pseudocapacitive behavior [44].
- Scan Rate Dependence: The relationship between current and scan rate (i = aνᵇ) helps distinguish between surface-controlled (b = 0.5) and diffusion-controlled (b = 1.0) processes [44].
Figure 2: Cyclic Voltammetry Experimental Workflow
Comparative Analysis: Technique Selection Guide
Direct Comparison of Technical Capabilities
Table 1: Technical Comparison between Constant-Current Charge/Discharge and Cyclic Voltammetry
| Parameter | Constant-Current Charge/Discharge | Cyclic Voltammetry |
|---|---|---|
| Primary Output | Voltage vs. time profile | Current vs. voltage plot |
| Measurement Type | Chronopotentiometry | Potentiodynamic |
| Key Parameters Obtained | Capacitance, ESR, energy density, power density, cycle life | Charge storage mechanism, redox potentials, kinetic information |
| Mechanism Identification | Limited distinction between EDLC and pseudocapacitance | Clear differentiation between EDLC and pseudocapacitance |
| Quantitative Accuracy | High for capacitance and energy calculations | Moderate, depends on integration and model |
| Speed of Analysis | Moderate to slow (requires full cycles) | Fast (single scans provide information) |
| Ideal Applications | Performance benchmarking, lifetime testing, practical efficiency | Mechanism studies, redox behavior, reaction kinetics |
Performance Parameter Comparison
Table 2: Characteristic Output Parameters from CCCD and CV Techniques
| Performance Metric | CCCD Characterization | CV Characterization |
|---|---|---|
| Specific Capacitance | Direct calculation from discharge slope: 260 F g⁻¹ achieved in solid-state systems [47] | Integration of CV curve area: Varies with scan rate [44] |
| Energy Density | Calculation based on V²: ~44 Wh kg⁻¹ with carbon fibers [4] | Derived from capacitance and voltage window [11] |
| Power Density | Up to 4780 W kg⁻¹ reported [47] | 10³-10⁵ W kg⁻¹ typically observed [48] |
| Cycle Life | >100,000 cycles demonstrated [48] | Limited cycling stability assessment |
| Rate Capability | Tested via current density variations | Assessed through scan rate dependence |
| Efficiency Analysis | Coulombic efficiency up to 99% [47] | Limited direct efficiency measurement |
| Charge Storage Mechanism | Indirect inference | Direct identification via curve shape |
Research Reagent Solutions and Materials
Table 3: Essential Research Materials for Supercapacitor Characterization
| Material Category | Specific Examples | Research Function |
|---|---|---|
| Electrode Materials | Activated carbon (1800 m² g⁻¹) [47], Carbon nanotubes, Graphene, MXenes [4] | High surface area substrates for charge storage |
| Pseudocapacitive Materials | RuO₂, MnO₂, NiO, Ni(OH)₂, conducting polymers (PANI, PPy) [4] [48] | Redox-active components enhancing energy density |
| Electrolytes | Aqueous (KOH, H₂SO₄), Organic (TEABF₄ in acetonitrile), Ionic liquids [47] [45] | Ion conduction medium determining voltage window |
| Current Collectors | Graphite sheets, Aluminum foil, Nickel foam [47] | Electron transfer pathway with minimal resistance |
| Separators | Glass fiber, Polypropylene membranes [11] | Electronic insulation with ionic permeability |
| Binder Materials | PTFE, PVDF, PEO-NaCF₃SO₃ [47] | Electrode integrity maintenance |
The comparative analysis of constant-current charge/discharge and cyclic voltammetry reveals that these techniques offer complementary rather than competing insights into supercapacitor performance. CCCD provides precise quantitative data on energy storage capacity, efficiency, and long-term stability under conditions mimicking real-world operation. Meanwhile, CV delivers mechanistic understanding of charge storage processes, distinguishing between capacitive and faradaic contributions, and identifying optimal potential windows for operation.
For comprehensive characterization of advanced supercapacitor materials, particularly in the context of evaluating energy density for different capacitor types, researchers should employ both techniques in tandem. This combined approach enables both the quantification of performance metrics and the understanding of underlying mechanisms driving that performance. As supercapacitor technology evolves toward hybrid systems combining multiple charge storage mechanisms, this dual-methodology approach becomes increasingly essential for rational material design and device optimization [44] [4] [11].
The accurate characterization of capacitance is foundational to evaluating the energy density of electrochemical capacitors, a critical parameter in the design of advanced energy storage systems. However, the inherent properties of supercapacitors, such as their porous electrode structure and complex charge redistribution dynamics, mean that different measurement protocols can yield significantly different results [49]. A specific artifact—the overestimation of capacitance from certain discharge current approaches—presents a substantial challenge for researchers comparing material performance or modeling system behavior. This guide objectively compares the performance outcomes of two established measurement methods, providing researchers with the experimental data and protocols necessary to identify and account for these method-specific artifacts within their broader capacitor research.
Comparative Analysis of Capacitance Measurement Methods
The following analysis contrasts the Method 1A of the IEC 62391-1 standard with the Total Charge Method, highlighting how the choice of protocol impacts the measured value of capacitance.
The IEC 62391-1 Method 1A
The IEC 62391-1 Method 1A is a standardized procedure for characterizing supercapacitors [49]. Its experimental protocol is well-defined:
- Charge the supercapacitor using a constant current until it reaches its rated voltage.
- Continue charging at a constant voltage (typically for 30 minutes) to ensure the device is fully charged.
- Discharge the supercapacitor using a constant current, ( I_{cc} ).
- Calculate the capacitance using the formula: [ C{IEC} = \frac{I{cc} \times (t2 - t1)}{U1 - U2} ] where ( U1 ) and ( U2 ) are the calculation start and end voltages, typically defined as 0.8 and 0.4 of the rated voltage ( UR ), and ( t1 ) and ( t_2 ) are the corresponding discharge times [49].
A key documented artifact of this method is that the calculated capacitance, ( C{IEC} ), decreases as the discharge current, ( I{cc} ), increases [49]. This current dependence makes the reported value specific to the test conditions.
The Total Charge Method
An alternative approach utilizes the total charge stored in the supercapacitor. This method involves a similar initial charge cycle but focuses on the integral of current over time during a full discharge to determine the total extracted charge, ( Q{total} ) [49]. The capacitance is then estimated based on this total charge and the voltage window. Experimental data consistently shows that the capacitance estimated using the total charge method, ( C{Total} ), is higher than that measured by the IEC method at the same discharge current [49]. Furthermore, the ratio ( C{Total} / C{IEC} ) is observed to be greater when the supercapacitor's terminal voltage is lower [49].
Quantitative Data Comparison
The following tables summarize the key experimental findings from comparative studies of these two methods.
Table 1: Impact of Discharge Current on Measured Capacitance (IEC Method)
| Supercapacitor Sample | Rated Capacitance | Discharge Current | Capacitance (( C_{IEC} )) | Reference |
|---|---|---|---|---|
| Sample 2 (AVX) | 100 F | 1 A | Decreases with increasing current | [49] |
| Sample 3 (Maxwell) | 350 F | Discharge current ( I_{cc} ) | Decreases with increasing current | [49] |
Table 2: Comparison of IEC vs. Total Charge Method
| Comparative Metric | Experimental Observation | Implication |
|---|---|---|
| Capacitance Value | ( C{Total} > C{IEC} ) | IEC method underestimates total stored charge. |
| Current Dependence | ( C{IEC} ) decreases with higher ( I{cc} ); ( C_{Total} ) is more stable | IEC value is protocol-specific. |
| Voltage Dependence | Ratio ( C{Total} / C{IEC} ) increases at lower terminal voltage | Artifact is more pronounced at lower states of charge. |
Experimental Protocols
To ensure reproducibility, the following protocols detail the key experiments cited in this guide.
This protocol is designed to directly compare the IEC 62391-1 Method 1A and the Total Charge Method.
A. Equipment Setup
- Supercapacitor Tester: An automated system, such as a Maccor Model 4304 tester.
- Test Samples: Supercapacitors with different rated capacitances (e.g., 10 F, 100 F, 350 F).
- Environmental Control: Tests should be performed at a stable room temperature.
B. Procedure
- Conditioning: Pre-condition the supercapacitor with several charge-discharge cycles.
- Charge Cycle:
- Charge the supercapacitor from 0 V to its rated voltage ( UR ) (e.g., 2.7 V) using a constant current. The standard suggests ( I{charge} = UR / (38 \times RN) ), where ( RN ) is the nominal internal resistance [49].
- Hold the voltage at ( UR ) for a specified duration (e.g., 30 minutes).
- Discharge Cycle (IEC Method):
- Discharge the supercapacitor with a constant current ( I{cc} ). For a 100 F, 2.7 V capacitor, a current of ~1 A may be used [49].
- Record the voltage profile over time with high resolution.
- Calculate ( C{IEC} ) using Equation (1) with ( U1 = 0.8UR ) and ( U2 = 0.4UR ).
- Discharge Cycle (Total Charge Method):
- Repeat steps 2 and 3, but discharge the supercapacitor fully to 0 V (or a defined cutoff).
- Calculate the total discharged charge, ( Q_{total} ), by integrating the current over the entire discharge time.
- Estimate ( C{Total} ) based on ( Q{total} ) and the voltage window.
C. Data Analysis
- Plot ( C{IEC} ) versus ( I{cc} ) for different samples to demonstrate the current-dependence artifact.
- For a fixed ( I{cc} ), calculate the ratio ( C{Total} / C_{IEC} ) for different supercapacitors.
This protocol provides an alternative characterization that explains the artifacts observed in time-domain methods.
A. Equipment Setup
- Potentiostat/Galvanostat with Electrochemical Impedance Spectroscopy (EIS) capabilities.
B. Procedure
- Set the DC bias voltage to the supercapacitor's rated working voltage.
- Apply a small AC voltage perturbation (e.g., 10 mV) over a wide frequency range (e.g., 100 kHz to 1 mHz).
- Measure the impedance spectrum (Nyquist plot).
C. Data Analysis
- Fit the impedance data to an equivalent circuit model, such as a series resistance ( Rs ) with a Constant Phase Element (CPE), where the impedance is ( Z{CPE} = 1 / [Q(j\omega)^\alpha] ) [50].
- The dispersion coefficient ( \alpha ) (where ( 0 < \alpha \leq 1 )) quantifies the deviation from an ideal capacitor (( \alpha = 1 )).
- An effective capacitance can be calculated from the CPE parameters [50].
Visualization of Methodologies and Relationships
The following diagrams illustrate the experimental workflows and the physical model used to explain the observed artifacts.
Experimental Workflow for Capacitance Comparison
Physical Model Explaining Measurement Artifacts
The Researcher's Toolkit: Essential Materials and Reagents
Table 3: Key Research Reagent Solutions and Experimental Materials
| Item | Function / Relevance in Capacitance Evaluation |
|---|---|
| Automated Supercapacitor Tester (e.g., Maccor 4304) | Provides precise control of charge/discharge cycles and high-resolution data logging of voltage and current profiles, which is critical for comparing methods [49]. |
| Potentiostat/Galvanostat with EIS | Enables frequency-domain impedance analysis to model the supercapacitor as a non-ideal CPE and understand the root causes of time-domain artifacts [50]. |
| Constant Phase Element (CPE) Model | A mathematical model used for fitting EIS data, characterized by parameters ( Q ) (pseudocapacitance) and ( \alpha ) (dispersion coefficient). It is essential for moving beyond ideal capacitor models [50]. |
| Five-Branch RC Ladder Circuit Model | A physical equivalent circuit model that captures the effects of a porous electrode structure, charge redistribution, and self-discharge, helping to explain the differences between ( C{IEC} ) and ( C{Total} ) [49]. |
| Arrhenius Model & Thermal Simulation Software (e.g., Icepak) | Used in conjunction with accelerated life testing to generate and analyze life data under thermal stress, linking operational conditions to long-term performance and reliability [51]. |
The evaluation of energy storage systems is critical for advancing modern technology, with energy density serving as a primary metric for comparing performance across applications. In the context of high-power pulse systems, renewable energy buffers, and electric vehicles (EVs), capacitors and supercapacitors occupy a unique position in the Ragone plot, bridging the gap between conventional capacitors and batteries [4]. Supercapacitors, also known as electrochemical capacitors, offer exceptional properties including high power density, rapid charging-discharging cycles, and long life cycles with high efficiency, making them suitable for applications requiring quick bursts of energy [4]. This review systematically compares the performance characteristics of different capacitor types, with a focused analysis on how their fundamental energy storage mechanisms translate to practical applications across three critical domains: high-power pulse systems, renewable energy integration, and electric vehicle technology.
The energy density of storage devices is fundamentally determined by their charge storage mechanisms. Traditional capacitors store energy electrostatically, offering high power but low energy density. In contrast, supercapacitors are classified based on their charge storage mechanisms into three primary categories: Electrical Double-Layer Capacitors (EDLCs) that store energy via electrostatic charge separation at the electrode-electrolyte interface, pseudocapacitors that employ fast surface redox reactions, and hybrid capacitors that combine both mechanisms to optimize performance [4]. Each architecture offers distinct trade-offs between energy density, power density, and cycle life that determine their suitability for specific applications within the landscape of high-power systems.
Table 1: Fundamental Characteristics of Major Capacitor Types
| Capacitor Type | Charge Storage Mechanism | Key Electrode Materials | Cycle Life | Self-Discharge Rate |
|---|---|---|---|---|
| Traditional Capacitor | Electrostatic charge separation | Metal plates, ceramic, polymer films | Virtually unlimited | Very Low |
| EDLC Supercapacitor | Electrostatic double-layer formation | Activated carbon, carbon nanotubes, graphene | >100,000 cycles | Moderate to High |
| Pseudocapacitor | Fast surface redox reactions | Metal oxides (RuO₂, MnO₂), conducting polymers | ~10,000 cycles | High |
| Hybrid Capacitor | Combined EDLC & pseudocapacitive | Composite electrodes (carbon-metal oxide) | ~50,000 cycles | Moderate |
Performance Comparison of Energy Storage Technologies
Quantitative Analysis of Energy and Power Parameters
The application landscape for high-performance capacitors requires careful consideration of both energy density (Wh/kg) and power density (W/kg). Supercapacitors typically occupy a performance range between traditional capacitors and batteries, with EDLCs offering power densities up to 10,000 W/kg but energy densities generally below 10 Wh/kg, while advanced hybrid configurations have demonstrated energy densities exceeding 60 Wh/kg while maintaining high power delivery capabilities [4]. This performance positioning makes them particularly valuable as gap-bridging devices in applications requiring both rapid energy discharge and moderate energy storage capacity.
Recent advancements in electrode materials have substantially improved the performance metrics of supercapacitors. Materials with high specific surface area such as activated carbon, graphene, and carbon nanotubes enhance capacitance by providing extensive interfaces for double-layer formation [4]. Meanwhile, pseudocapacitive materials including metal oxides (e.g., MnO₂, RuO₂) and conducting polymers (e.g., PANI, PPy) contribute additional faradaic charge storage, significantly increasing overall capacitance [4]. The development of hybrid architectures that strategically combine these materials has enabled researchers to achieve superior performance characteristics optimized for specific application requirements.
Table 2: Performance Comparison of Energy Storage Technologies
| Technology | Energy Density (Wh/kg) | Power Density (W/kg) | Efficiency (%) | Key Advantages |
|---|---|---|---|---|
| Traditional Capacitors | <0.1 | >10,000 | >95 | Extremely fast response, high cycle stability |
| EDLC Supercapacitors | 1-10 | 1,000-10,000 | 85-98 | High power, long cycle life, rapid charging |
| Pseudocapacitors | 5-15 | 500-5,000 | 80-95 | Enhanced energy density, redox activity |
| Hybrid Supercapacitors | 10-60 | 500-10,000 | 85-95 | Balanced energy/power density |
| Li-ion Batteries | 100-265 | 250-340 | 80-90 | High energy density |
| Fuel Cells | 500-1,000 | 500-1,000 | 40-60 | Continuous power generation |
Emerging Materials and Commercial Readiness
The innovation pipeline for supercapacitor technologies includes several promising material systems with potential to enhance energy density without sacrificing power capabilities. MXenes and Metal-Organic Frameworks (MOFs) represent emerging categories of electrode materials that offer high electrical conductivity and tunable porous structures, potentially enhancing both capacitance and rate capability [4]. Additionally, waste-derived carbon electrodes have gained attention for developing cost-effective and sustainable supercapacitors with competitive electrochemical performance [4].
From a commercial perspective, supercapacitor technology has achieved significant Technology Readiness Levels (TRL), with numerous products available from global manufacturers including Enercap Holdings, Longyuan Power, Skeleton Technologies, and Keltron Component Complex Ltd [4]. Government and private sector investments are accelerating commercialization, exemplified by the U.S. Department of Energy's Advanced Materials and Manufacturing Technologies program, which has sanctioned $25.54 million to develop advanced materials for energy storage devices including supercapacitors [4]. The Capacitoxx project, funded by the EU and coordinated by TUBEX NRG Ltd., successfully developed a hybrid cell integrating supercapacitor and battery technology capable of extending charge cycles to 1 million, demonstrating the potential for extreme durability in specialized applications [4].
Application-Specific Technical Requirements
High-Power Pulse Systems
All-solid-state high voltage pulse power supplies represent a critical application domain where capacitors and supercapacitors provide essential functionality. The global market for these systems is projected to grow at a robust Compound Annual Growth Rate (CAGR) of 15% through 2033, driven by escalating demand across scientific research, medical equipment, and industrial automation [52]. These systems are valued for their enhanced reliability, precision control, compact design, and superior pulse shaping capabilities compared to traditional technologies [52].
In scientific research applications such as particle accelerators and fusion energy experiments, pulse power supplies require extremely controlled and reproducible high-voltage pulses with fast rise times and precise waveform control [52] [53]. Similarly, medical applications including medical imaging and non-invasive treatments such as pulsed electric field (PEF) therapies demand highly reliable pulse generation with patient safety as a paramount concern [52] [53]. Industrial automation applications including laser processing, welding, and material synthesis require robust systems capable of operating in demanding environments with minimal maintenance [52].
Table 3: High-Power Pulse System Requirements by Application Domain
| Application Domain | Voltage Requirements | Pulse Characteristics | Critical Performance Parameters |
|---|---|---|---|
| Scientific Research | Up to 100+ million volts | Nanosecond rise times, high reproducibility | Waveform precision, stability, reliability |
| Medical Equipment | Medium to high voltage | Controlled pulse shapes, specific durations | Patient safety, consistency, EMI control |
| Industrial Automation | Wide range depending on process | Custom waveforms, variable repetition rates | Durability, efficiency, thermal management |
Technological innovation in this sector is characterized by the adoption of wide-bandgap semiconductors such as Silicon Carbide (SiC) and Gallium Nitride (GaN), which enable higher switching frequencies, increased power density, and improved thermal management [52]. The transition from traditional tube-based systems to all-solid-state designs has been accelerated by the superior performance characteristics of these materials, including higher efficiency, reduced system footprint, and enhanced pulse control capabilities [53].
Renewable Energy Buffer Systems
The integration of renewable energy sources with energy storage systems addresses the fundamental challenge of intermittency in solar and wind power generation. Supercapacitors serve as ideal buffer devices in these applications due to their rapid charging-discharging capabilities, high efficiency, and long cycle life [54] [4]. When deployed alongside intermittent renewable generation, supercapacitors can smooth power fluctuations, provide frequency regulation, and enhance overall system stability.
Advanced energy storage technologies being deployed for renewable integration include:
- Compressed Air Energy Storage (CAES): Modern systems utilize isothermal compression technologies to reduce energy losses, with air stored in underground caverns or specialized tanks for later electricity generation [55].
- Superconducting Magnetic Energy Storage (SMES): These systems store energy in magnetic fields created by direct current in superconducting coils, offering near-instant response times and high efficiency with minimal energy loss during storage [55].
- Hybrid Storage Systems: Combinations of supercapacitors with batteries or other storage technologies create systems that leverage the high power density of supercapacitors with the high energy density of batteries, optimizing both performance and cost [4].
Research in Virtual Power Plant (VPP) platforms has explored optimized approaches for integrating renewable generation with distributed energy storage resources, including supercapacitor-based systems [54]. These platforms enable aggregated control of distributed assets to provide grid services and enhance the utilization of renewable energy, particularly in the context of supporting the growing electrification of transportation.
Diagram 1: Renewable energy buffer system
Electric Vehicle Applications
Electric vehicles represent a complex application domain where supercapacitors serve multiple functions, including regenerative braking energy capture, acceleration assist, and power grid stabilization when integrated with charging infrastructure [4]. The fundamental efficiency advantage of EVs - converting approximately 60% of electrical energy to propulsion, compared to 20-30% for internal combustion engines - can be further enhanced through strategic implementation of supercapacitor technology [54].
The Next-Generation Profiles (NextGen Profiles) project, led by the U.S. Department of Energy's Electric Vehicles at Scale Consortium (EVs@Scale Lab Consortium), addresses critical challenges in high-power charging infrastructure, including reliability, interoperability, and grid impact [56]. This research focuses on characterizing EV charging profiles and electric vehicle supply equipment (EVSE) performance under various conditions, including off-nominal temperature tests that evaluate charging behavior in extreme hot and cold environments [56]. Understanding these dynamics is essential for designing effective energy storage buffers that can support the transition to high-power charging systems capable of delivering 200kW and above [56].
Supercapacitors are particularly valuable in EV applications for regenerative braking systems, where they can capture and store braking energy more efficiently than batteries due to their rapid charge acceptance capabilities [4]. This captured energy can then be deployed for acceleration, reducing the demand on the main battery and extending its useful life. Additionally, hybrid energy storage systems combining batteries and supercapacitors have been implemented in heavy machinery and commercial vehicles to optimize both energy density and power density for specific duty cycles [4].
Diagram 2: EV power management system
Experimental Protocols and Methodologies
Standardized Testing Approaches
The evaluation of capacitor performance follows standardized experimental protocols to ensure comparable results across different technologies and research initiatives. For supercapacitors, key characterization methods include:
- Cyclic Voltammetry (CV): Measures current response to a linearly scanned voltage, providing information about charge storage mechanisms, capacitance, and redox behavior. Standard protocols use scan rates from 1-100 mV/s in various electrolyte systems [4].
- Galvanostatic Charge-Discharge (GCD): Applies constant current to determine capacitance, equivalent series resistance, and cycle life through repeated cycling, typically over thousands of cycles [4].
- Electrochemical Impedance Spectroscopy (EIS): Analyzes frequency-dependent impedance to characterize charge transfer processes, ion diffusion, and overall system resistance, typically spanning frequency ranges from 10 mHz to 100 kHz [4].
The NextGen Profiles project has established comprehensive testing procedures for EV and charging infrastructure components, including off-nominal temperature tests where systems are subjected to cold, nominal (23°C), and hot temperatures followed by detailed analysis of charging performance and battery behavior [56]. These environmental tests are complemented by grid disturbance analysis that subjects charging stations to repeated high-power charging cycles to evaluate thermal management and recovery behavior [56].
Advanced Characterization Techniques
Research-grade evaluation of capacitor technologies often employs specialized methodologies to understand fundamental material properties and system behaviors:
- In situ/Operando Analysis: Real-time monitoring of structural and chemical changes during operation using techniques such as X-ray diffraction and spectroscopy [4].
- Pore Size Distribution Analysis: Characterization of electrode material porosity using gas adsorption techniques to optimize the compatibility between pore size and electrolyte ion dimensions [4].
- Accelerated Lifetime Testing: Subjecting devices to extreme conditions (elevated temperature, voltage) to predict long-term performance and degradation mechanisms [4].
- Thermal Runaway Testing: Evaluation of safety performance under abusive conditions including overvoltage, short circuit, and elevated temperature operations [4].
For high-power pulse systems, characterization includes precise measurements of rise and fall times, pulse fidelity, repetition rate capabilities, and long-term stability under operational conditions [52] [53]. These measurements require specialized instrumentation including high-bandwidth oscilloscopes, high-voltage probes, and custom load circuits capable of handling extreme power levels.
Essential Research Reagents and Materials
The development and testing of advanced capacitor technologies requires specialized materials and characterization tools. The following table details key research reagents and their functions in supercapacitor development and evaluation.
Table 4: Essential Research Reagents and Materials for Supercapacitor Development
| Material/Reagent | Function | Application Examples | Key Characteristics |
|---|---|---|---|
| Activated Carbon | EDLC electrode material | Commercial supercapacitors | High specific surface area (1500-3000 m²/g), moderate conductivity |
| Graphene/RGO | Advanced carbon electrode | High-performance EDLCs | Excellent electrical conductivity, theoretical SSA ~2630 m²/g |
| Transition Metal Oxides | Pseudocapacitive electrode | RuO₂, MnO₂, NiO-based devices | Redox activity, multiple oxidation states, high theoretical capacitance |
| Conducting Polymers | Pseudocapacitive electrode | PANI, PPy, PEDOT-based capacitors | Tunable conductivity, flexibility, synthetic versatility |
| Organic Electrolytes | High-voltage electrolyte | Commercial cells >2.5V | Wide voltage window (~3V), flammability concerns |
| Ionic Liquids | Advanced electrolyte | High-voltage, high-temperature applications | Wide voltage window (>3V), low vapor pressure, thermal stability |
| Aqueous Electrolytes | Low-cost, safe option | Research, hybrid systems | Limited voltage (~1.2V), high conductivity, non-flammable |
| Separator Membranes | Electronic isolation, ion transport | Celgard, glass fiber separators | Electronic insulator, ionic conductor, mechanical strength |
The application landscape for high-power pulse systems, renewable energy buffers, and electric vehicles demonstrates the critical importance of capacitor technologies with optimized energy density characteristics. Each application domain presents distinct requirements that drive the selection and development of appropriate capacitor solutions, from all-solid-state high-voltage pulse power supplies requiring precise waveform control to renewable energy buffers demanding rapid response and high cycle life, to electric vehicle systems that benefit from hybrid approaches combining the complementary strengths of batteries and supercapacitors.
The ongoing advancement of capacitor technologies continues to be fueled by innovations in materials science, particularly through the development of nanostructured electrodes, advanced electrolytes, and hybrid architectures that push the boundaries of energy and power density. As research progresses, the integration of these technologies within broader energy systems will play an increasingly important role in enabling the transition to renewable energy and electrified transportation, supported by comprehensive testing methodologies and standardized characterization protocols that ensure reliable performance across diverse operating conditions.
This comparison guide objectively evaluates the performance of a novel carbide-derived carbon (CDC) based energy storage device, reporting a volumetric energy density of 12.2 Wh/L, against established and emerging capacitor technologies. Framed within a broader thesis on capacitor energy density, this analysis provides critical, data-driven insights for researchers and scientists. The guide synthesizes comparative performance metrics, details essential experimental protocols for device fabrication and testing, and visualizes the key material synthesis pathways. By contextualizing this specific demonstrator's achievement within the current technology landscape, this document serves as a toolkit for assessing the developmental stage and potential applications of advanced capacitor technologies.
Performance Comparison of Capacitor Technologies
The pursuit of higher energy density in capacitors is a central focus of energy storage research. The achievement of 12.2 Wh/L with a novel Carbide-Derived Carbon (CDC) positions it as a notable advancement in the field. The following tables provide a structured comparison with other capacitor types and competing energy storage devices, based on current market and research data.
Table 1: Volumetric and Gravimetric Energy Density Comparison of Capacitor Types
| Capacitor Technology | Typical Volumetric Energy Density (Wh/L) | Typical Gravimetric Energy Density (Wh/kg) | Key Characteristics |
|---|---|---|---|
| Novel CDC (This Study) | 12.2 | Data from study | Focus on improved porosity and surface area from carbide precursor. |
| Conventional Double-Layer Capacitor (EDLC) [57] | ~7-8 [58] | ~5-7 [58] | Relies on activated carbon; high power density, long cycle life. |
| Advanced Commercial Supercapacitor | ~14-15 [58] | ~14-15 [58] | e.g., Lignavolt-based devices using nano-porous carbon from pulp byproducts. |
| Lithium-Ion Capacitor (LiC) [59] | Varies with design | Varies with design | Hybrid device; combines battery-type anode with capacitor-type cathode. |
| Pseudocapacitor [60] | Higher than EDLCs | Higher than EDLCs | Utilizes fast, reversible surface redox reactions. |
| Hybrid Capacitor [60] | Higher than EDLCs | Higher than EDLCs | Merges EDLC and pseudocapacitive materials. |
Table 2: Broader Energy Storage Device Performance Landscape
| Device Technology | Energy Density (Gravimetric) | Energy Density (Volumetric) | Power Density | Cycle Life |
|---|---|---|---|---|
| Novel CDC Capacitor | Data from study | 12.2 Wh/L | High | Very Long (e.g., >100,000) |
| Commercial Supercapacitors [61] | Low to Moderate | Low to Moderate | Very High (Rapid charge/discharge) | Very Long (>100,000) |
| Lithium Iron Phosphate (LFP) Battery [59] | High | High | Moderate | ~3,000 - 7,000 |
| Panasonic Roadmap Li-ion [62] | ~330 Wh/kg (target) | ~1000 Wh/L (target by 2031) | Moderate | ~1,000 - 2,000 |
| Solid-State Battery (Factorial Solstice) [63] | 390-450 Wh/kg | High | Moderate | Data under development |
Contextualizing 12.2 Wh/L: The reported volumetric energy density of 12.2 Wh/L for the novel CDC demonstrator represents a significant improvement over conventional EDLCs but remains below the highest-end supercapacitor technologies recently announced, such as the Lignavolt-based supercapacitors claiming 14-15 Wh/kg [58]. This positions the CDC technology as a competitive and promising candidate in the ongoing evolution of supercapacitors, particularly if the CDC structure offers additional benefits like cost-effectiveness or superior cycle life.
The Energy Gap with Batteries: Despite this progress, the data underscores the persistent performance gap between capacitors and batteries. Even next-generation solid-state batteries are targeting energy densities of 390-450 Wh/kg [63], orders of magnitude higher than any current capacitor. This highlights the fundamental trade-off: capacitors excel at high power delivery and long cycle life, not at storing large amounts of energy for long durations.
The Promise of Hybrids: The emergence of hybrid technologies like the lithium-ion capacitor (LiC) and supercapattery is a direct response to this trade-off. These devices aim to occupy a middle ground, offering higher energy density than pure capacitors while maintaining higher power density and longer life than batteries [59] [64]. The performance of the novel CDC could be highly relevant for the capacitive electrode in such hybrid systems.
Experimental Protocols & Methodologies
Reproducibility is a cornerstone of scientific research. This section outlines standard experimental protocols for fabricating and evaluating carbon-based supercapacitors, which form the basis for assessing the novel CDC material.
Key Experimental Workflow
The following diagram outlines the general workflow for the synthesis, fabrication, and testing of a CDC-based supercapacitor electrode.
CDC Supercapacitor Fabrication and Testing Workflow
Detailed Experimental Methodologies
1. Electrode Fabrication Protocol This protocol details the process of creating a working electrode from the synthesized CDC powder [64].
- Materials: Active material (novel CDC powder), conductive agent (e.g., carbon black, 5-10 wt%), binder (e.g., PTFE or PVDF, 5-10 wt%), and solvent (e.g., N-Methyl-2-pyrrolidone (NMP) for PVDF).
- Procedure:
- Slurry Preparation: Precisely weigh the CDC material, conductive agent, and binder. Mix them in the solvent to form a homogeneous slurry. Ultrasonication and mechanical stirring are typically employed to ensure uniformity.
- Coating: The slurry is uniformly coated onto a current collector (typically aluminum foil for supercapacitors) using a doctor blade coater to control thickness.
- Drying: The coated electrode is dried in a vacuum oven at elevated temperature (e.g., 100-120 °C) for several hours to remove the solvent completely.
- Pressing: The dried electrode may be calendared (pressed) to enhance the electrical contact between particles and achieve a uniform density.
2. Electrochemical Testing Protocols A standard three-electrode setup is first used to characterize the individual CDC electrode's performance. This is followed by two-electrode cell testing to evaluate the full device [64].
Three-Electrode Setup:
- Working Electrode: The fabricated CDC electrode.
- Counter Electrode: An inert electrode, often platinum mesh or foil.
- Reference Electrode: e.g., Ag/AgCl or saturated calomel electrode (SCE).
- Electrolyte: Aqueous (e.g., H₂SO₄, KOH) or organic (e.g., TEABF₄ in acetonitrile), depending on the target operating voltage.
Key Electrochemical Techniques:
- Cyclic Voltammetry (CV):
- Purpose: To study charge storage mechanisms (capacitive vs. pseudocapacitive) and electrochemical stability.
- Protocol: The potential of the working electrode is scanned linearly between set voltage limits at various scan rates (e.g., from 5 mV/s to 200 mV/s). A rectangular-shaped CV curve indicates ideal capacitive behavior.
- Galvanostatic Charge-Discharge (GCD):
- Purpose: To directly measure capacitance, energy density, power density, and cycle life.
- Protocol: The cell is charged and discharged at constant current densities (e.g., from 0.1 A/g to 10 A/g) between specific voltage windows. The specific capacitance (F/g) is calculated from the discharge curve using the formula: ( C = (I \times \Delta t) / (m \times \Delta V) ), where ( I ) is current, ( \Delta t ) is discharge time, ( m ) is active mass, and ( \Delta V ) is voltage change.
- Energy Density Calculation: The volumetric energy density (Wh/L) reported in the case study is derived from device-level GCD data using the formula: ( E = (C{cell} \times V^2) / (2 \times 3.6 \times Volume) ), where ( C{cell} ) is the cell capacitance in Farads, ( V ) is the operating voltage, and the denominator converts Joules to Wh/L.
- Electrochemical Impedance Spectroscopy (EIS):
- Purpose: To analyze internal resistance, charge transfer kinetics, and ion diffusion.
- Protocol: A small AC voltage perturbation (e.g., 5-10 mV) is applied over a wide frequency range (e.g., 100 kHz to 10 mHz). The resulting Nyquist plot reveals information about the electrolyte resistance, charge transfer resistance, and Warburg diffusion element.
- Cyclic Voltammetry (CV):
The Scientist's Toolkit: Research Reagent Solutions
This section catalogs the critical materials and reagents essential for the fabrication and evaluation of advanced carbon-based supercapacitors, as referenced in the experimental protocols.
Table 3: Essential Materials for Supercapacitor Research
| Research Reagent / Material | Function & Rationale |
|---|---|
| Carbide-Derived Carbon (CDC) | The active material under investigation. Its unique, tunable pore network (micro and mesopores), derived from a carbide precursor (e.g., TiC, SiC), is designed for optimal ion accessibility and charge storage [64]. |
| Activated Carbon | The benchmark active material for EDLCs. High specific surface area (often >1500 m²/g) provides the foundation for electrostatic charge storage via the electric double-layer [57]. |
| Conductive Additive (Carbon Black) | Mixed with the active material to enhance the electrode's electronic conductivity, ensuring efficient electron transport throughout the porous structure. |
| Binder (PVDF, PTFE) | A polymer that binds active material particles and conductive additives together, and to the current collector, ensuring mechanical integrity of the electrode. |
| Current Collector (Aluminum Foil) | Provides a high-conductivity path for electrons to travel to/from the external circuit. Aluminum is stable in non-aqueous electrolytes. |
| Organic Electrolyte (e.g., TEABF₄ in Acetonitrile) | Provides ionic conductivity within the cell. Organic electrolytes enable higher operating voltages (~2.5-2.7 V) than aqueous systems, which is critical for achieving high energy density (E ∝ V²) [64]. |
| Aqueous Electrolyte (e.g., KOH, H₂SO₄) | Offers high ionic conductivity and lower cost. Used for fundamental studies and applications where a lower voltage window (~1.0 V) is acceptable. |
| Separator (Celgard, Glass Fiber) | A porous, electronically insulating membrane placed between electrodes to prevent short circuits while allowing ion transport. |
Material Synthesis and Charge Storage Pathways
The performance of the supercapacitor is fundamentally governed by the synthesis of the active material and its charge storage mechanisms. The following diagram illustrates the synthesis pathway for CDC and the concurrent charge storage mechanisms in the final device.
CDC Synthesis and Charge Storage Mechanisms
Overcoming Energy Density Limitations and System Optimization Strategies
The accurate assessment of energy density is a cornerstone for advancing capacitor technologies, from traditional dielectric capacitors to advanced supercapacitors. However, significant inconsistencies in measurement protocols across research and industry hinder objective comparison and slow the pace of innovation. For supercapacitors specifically, industrial devices have shown remarkably stagnant progress in energy density, improving only incrementally from 7 Wh/L in 2002 to 10 Wh/L in 2016, despite numerous academic publications reporting dramatically higher performance [1]. This stark contrast between research achievements and commercial implementation points to a critical standardization gap in how energy storage performance is quantified and reported.
The core of the problem lies in the diversity of evaluation techniques, testing conditions, and reporting methods employed across studies. Research literature often reports optimized values achieved under ideal laboratory conditions, while industrial measurements reflect performance in practical applications with all their inherent constraints. This discrepancy creates an information gap that prevents the translation of promising research findings into commercial innovations [1]. Without standardized protocols that align methodological selection with operational requirements and material properties, objective comparison between different capacitor technologies remains challenging.
Comparative Analysis of Measurement Methods
Methodological Approaches and Their Limitations
A systematic comparison of five characterization techniques for dielectric capacitors reveals substantial variations in reported energy density values, highlighting the critical need for measurement standardization. The hysteresis loop integration method (Method A) is widely regarded as a reliable benchmark, directly measuring the energy stored and released during charge-discharge cycles by integrating the area between the charging and discharging curves of the polarization-electric field loop [39]. In contrast, the discharge current method (Method B) tends to systematically overestimate energy density due to unaccounted energy losses in the circuit, while the equivalent capacitance method (Method C) often underestimates performance because it fails to adequately capture nonlinear dielectric behavior at high voltages [39].
Two additional methods show promise for practical implementation: UI curve integration (Method D) incorporates time-resolved voltage with current measurements to calculate energy delivery, and the resistive consumption method (Method E) quantifies energy through measured losses across a known resistance [39]. The variability between these methods stems from fundamental differences in what each technique actually measures—whether circuit-level performance, material-intrinsic properties, or operational characteristics—underscoring the necessity of matching methodological selection to both material properties and intended application requirements.
Comparative Performance Data
Table 1: Comparison of Energy Density Measurement Methods for Dielectric Capacitors
| Method | Technical Principle | Reported Energy Density (RFE) | Reported Energy Density (AFE) | Key Limitations |
|---|---|---|---|---|
| Hysteresis Loop Integration | Integrates area between charge/discharge curves | 14.1 J/cm³ (Reference) | 12.8 J/cm³ (Reference) | Considered reliable benchmark |
| Discharge Current | Derives from capacitance via RLC circuit discharge | 5.94 J/cm³ (58% lower than reference) | Significant overestimation | Overestimates due to unaccounted losses |
| Equivalent Capacitance | Uses DC-bias-dependent capacitance | Systematic underestimation | Systematic underestimation | Fails to capture nonlinear behavior |
| UI Integration | Time-resolved voltage with current measurement | Consistent with Method A | Consistent with Method A | Shows promise for practical implementation |
| Resistive Consumption | Quantifies losses through known resistance | Consistent with Method A | Consistent with Method A | Shows promise for practical implementation |
The discrepancies illustrated in Table 1 demonstrate how methodological choices can dramatically influence reported performance metrics. For instance, in NaNbO3 capacitor systems, hysteresis loop integration reported 14.1 J/cm³, while discharge current measurements yielded only 5.94 J/cm³—a variance of nearly 60% [39]. Such inconsistencies complicate technology assessments and obscure genuine material advancements, particularly when different researchers employ non-equivalent characterization techniques.
Standardization Protocols for Consistent Measurement
Normalization Techniques for Cross-Study Comparison
To enable fair comparisons between studies, researchers have developed normalization techniques that account for variations in testing conditions, cell designs, and reporting methods. Areal capacity adjustment addresses discrepancies from differences in electrode loading by calculating specific energy based on a standardized areal capacity, typically between 3-5 mAh/cm² [65]. This approach isolates the impact of electrode design, allowing focus on material-level improvements rather than structural optimization.
C-rate normalization accounts for the influence of discharge rate on energy density measurements, as higher C-rates typically reduce usable energy due to polarization losses [65]. This involves adjusting reported values to a common C-rate (such as C/10 or C/3) using empirical rate-capacity relationships, ensuring comparisons reflect similar operating conditions. Additionally, packaging exclusion removes the weight and volume contributions of non-active components (casings, current collectors, separators) to reveal intrinsic energy density at the material level [65]. While this approach is valuable for assessing fundamental material advancements, it must be clearly distinguished from practical cell-level metrics that reflect real-world performance.
Table 2: Energy Density Normalization Example for Supercapacitors
| Metric | Raw Value | Normalized Value | Normalization Basis |
|---|---|---|---|
| Gravimetric Energy Density | 180 Wh/kg | 240 Wh/kg | Adjusted to 4 mAh/cm², C/10, active materials only |
| Volumetric Energy Density | 400 Wh/L | 550 Wh/L | Adjusted to 4 mAh/cm², C/10, active materials only |
| Areal Capacity | 2 mAh/cm² | 4 mAh/cm² | Standardized electrode loading |
| Discharge Rate | 1C | C/10 | Normalized to common discharge rate |
Method Selection Framework
The establishment of standardized protocols requires a method selection framework that aligns measurement approaches with specific application requirements and material characteristics. For dielectric capacitors in pulsed power applications, hysteresis loop integration provides the most reliable benchmarking for material comparison, while UI integration and resistive consumption methods offer superior consistency for practical implementation [39]. This framework should include standardized reporting of key parameters including areal capacity, C-rate, voltage window, temperature, and cycling stability to enable meaningful cross-study comparisons.
The experimental workflow for proper capacitor energy density assessment involves multiple critical decision points that influence measurement outcomes. The following diagram outlines the standardized protocol for selecting appropriate measurement methodologies based on capacitor type and application requirements:
Research Reagent Solutions for Capacitor Testing
The experimental evaluation of capacitor energy density requires specific materials and measurement tools to ensure reproducible results. The following table details essential research reagents and their functions in capacitor performance characterization:
Table 3: Essential Research Reagent Solutions for Capacitor Energy Density Testing
| Reagent/Material | Function in Testing | Application Examples |
|---|---|---|
| Ionic Liquid Electrolytes | High voltage window (up to 4V) enables increased energy density | EMIMBF₄ used in high-performance graphene scroll supercapacitors [66] |
| Biomass-Derived Carbon | Sustainable electrode material with tunable porosity | Lignavolt from pulp industry byproducts achieves 14-15 Wh/kg [58] |
| Nitrogen-Doped Graphene | Prevents restacking, enhances electrical conductivity | NTGS electrodes show 206 Wh/kg energy density [66] |
| Asymmetric Electrode Design | Optimizes potential range utilization in electrolytes | Industry standard for increasing operating voltage to 3.0V [1] |
| Machine Learning Algorithms | Predicts performance from material characteristics | LightGBM (R²=0.922) for energy density prediction [10] |
These research reagents enable the fabrication and testing of advanced capacitor technologies. For instance, ionic liquids like EMIMBF₄ allow operational voltage windows up to 4V, dramatically improving energy density according to the equation E=0.5·C·U², where energy increases with the square of the voltage [1] [66]. Similarly, biomass-derived carbons such as Lignavolt represent sustainable alternatives to conventional materials, achieving double the energy density of traditional supercapacitors (14-15 Wh/kg versus 7-8 Wh/kg) while utilizing industrial byproducts [58].
Machine learning algorithms have emerged as virtual "reagents" in the research process, accelerating material discovery and performance optimization. The LightGBM model demonstrates exceptional capability for predicting energy density (R²=0.922), while XGBoost effectively predicts power density (R²=0.984) based on biomass raw material characteristics [10]. These computational tools help researchers identify promising material compositions before undertaking labor-intensive experimental work, streamlining the development process for advanced energy storage materials.
The development of standardized protocols for capacitor energy density measurement is essential for translating research innovations into practical applications. Significant discrepancies between measurement methods—with variations exceeding 60% in some cases—highlight the critical need for methodological consistency and comprehensive reporting standards [39]. By adopting normalization techniques that account for areal capacity, C-rate, and packaging factors, researchers can enable meaningful cross-study comparisons that accurately reflect material advancements rather than measurement artifacts [65].
A robust standardization framework must align methodological selection with both material properties and application requirements, recognizing that no single technique is universally optimal across all capacitor technologies and use cases. Future efforts should focus on establishing international standards for energy density measurement, reporting, and normalization, particularly as emerging technologies like machine learning accelerate material discovery [10] [1]. Such standardization will bridge the current gap between research achievements and commercial implementation, ultimately accelerating the development of advanced energy storage solutions that meet growing global demands.
The relentless pursuit of advanced energy storage technologies has catalyzed the development of novel materials with exceptional properties. Among these, MXenes, Metal-Organic Frameworks (MOFs), graphene, and waste-derived carbons represent the vanguard of material innovation for capacitive energy storage. These materials offer distinct advantages in surface area, electrical conductivity, porosity, and sustainability—critical parameters that directly influence energy density. This guide provides an objective comparison of these material classes, focusing on their performance in capacitors and supercapacitors within the specific context of energy density research. By presenting synthesized experimental data and detailed methodologies, we aim to equip researchers with the necessary information to select and optimize materials for next-generation energy storage systems.
Comparative Performance Analysis of Advanced Materials
The energy storage performance of MXenes, MOFs, graphene, and waste-derived carbons varies significantly due to their inherent material properties and charge storage mechanisms. The table below provides a quantitative comparison of their key performance metrics in supercapacitor and related hybrid energy storage devices.
Table 1: Performance Comparison of Advanced Energy Storage Materials
| Material Class | Specific Capacitance/Capacity | Energy Density | Power Density | Cycle Life (Retention %) | Key Advantages |
|---|---|---|---|---|---|
| MXene/MOF Composites | N/A | N/A | N/A | N/A | Synergistic effect: High porosity from MOFs and superior conductivity from MXenes. [67] [68] |
| MOF-Derived Materials | N/A | N/A | N/A | N/A | Exceptionally high surface area and tunable pore architectures. [68] |
| Graphene (3D-Structured) | 698 mAh g⁻¹ (as battery anode) [69] | 105 Wh kg⁻¹ (in LIC configuration) [70] | 700 W kg⁻¹ (in LIC configuration) [70] | 91% after 300 cycles (anode) [69] | High surface area (~2630 m² g⁻¹), excellent electrical/thermal conductivity. [69] |
| Waste-Derived Carbon (Biomass) | 112 mAh g⁻¹ (Hard carbon anode at 10C) [70] | 105 Wh kg⁻¹ (in LIC configuration) [70] | 700 W kg⁻¹ (in LIC configuration) [70] | 60% after 10,000 cycles (in LIC) [70] | Cost-effective, sustainable source, high surface area (e.g., 2399 m² g⁻¹) [70] |
| Lithium-Sulfur Graphene Battery | N/A | Superior to traditional Li-ion [71] | N/A | N/A | High energy density, attractive for EVs and aerospace. [71] |
Table 2: Analysis of Material Characteristics and Applicability
| Material Class | Charge Storage Mechanism | Typical Synthesis Methods | Challenges & Limitations | Suitability for Capacitor Types |
|---|---|---|---|---|
| MXenes | Electrical double-layer (EDL) & Pseudocapacitance [67] | Selective etching, Hydrothermal [67] [68] | Susceptible to oxidation, prone to restacking [68] | EDLCs, Pseudocapacitors, Hybrid capacitors [67] |
| MOFs & Derivatives | EDL (Derived carbons), Pseudocapacitance (composites) [68] | Solvothermal, Pyrolysis, In-situ growth [68] | Low intrinsic electrical conductivity [68] | Primarily EDLCs after pyrolysis, Hybrid systems [68] |
| Graphene | Electrical double-layer (EDL) [67] [69] | CVD, Hummers', LIG, Liquid-phase exfoliation [69] | Irreversible capacity loss, sheet aggregation, high production cost [69] | EDLCs, Lithium-Ion Capacitors (LICs) [70] [67] |
| Waste-Derived Carbons | Electrical double-layer (EDL) [72] | Pyrolysis, Catalytic pyrolysis, Flash Joule Heating [72] | Variable properties, potential impurities [72] | EDLCs, Lithium-Ion Capacitors (LICs) [70] [72] |
Detailed Experimental Protocols and Methodologies
Density Functional Theory (DFT) Analysis for MOFs
DFT calculations provide profound insights into the electronic interactions and binding energies in materials at the atomic level, which is crucial for predicting and understanding their performance in energy storage.
- Computational Software and Model: Calculations are performed using the Gaussian 16 software suite. A finite cluster model based on the UiO-66 MOF topology is typically constructed, featuring a central Zr₆O₄(OH)₄ node and four functionalized 1,4-benzenedicarboxylate (BDC) linkers to represent the local coordination environment. [73]
- Functional and Basis Set: The M06-2X meta-hybrid density functional is employed due to its superior performance for transition metal coordination and non-covalent interactions. The def2-TZVP (triple-zeta valence plus polarization) basis set is used for all atoms, with effective core potentials (ECPs) applied to Zr and Cd atoms to manage computational cost. [73]
- Solvation and Geometry Optimization: The SMD implicit solvation model is used to simulate solvent effects (e.g., water, ethanol, acetonitrile). Geometry optimizations use the Berny algorithm with tight convergence criteria (maximum force < 1.5 × 10⁻⁵ Hartree/Bohr; RMS force < 1.0 × 10⁻⁵ Hartree/Bohr). [73]
- Data Analysis: Natural Bond Orbital (NBO) analysis is conducted to evaluate charge transfer. Multiple initial binding geometries are sampled to ensure the identification of the most stable configuration. [73]
Synthesis of MXene/MOF-Derived Composites
The integration of MXenes and MOFs combines high conductivity with tunable porosity, creating synergistic effects for enhanced energy storage.
- MXene Preparation: MXene (e.g., Ti₃C₂Tₓ) is typically synthesized from the MAX phase (e.g., Ti₃AlC₂) by selective etching of the Al layer using concentrated hydrofluoric acid (HF) or a mixture of HCl and LiF. The resulting multilayer MXene is then delaminated into few-layer nanosheets via ultrasonication in a protective solvent like tetrahydrofuran or N-methylpyrrolidone to prevent oxidation. [68]
- In Situ Growth of MOF on MXene: The synthesized MXene dispersion is added to a solution containing dissolved metal ions (e.g., Co²⁺ from Co(NO₃)₂·6H₂O) and organic ligands (e.g., 2-methylimidazole). The MOF (e.g., ZIF-67) grows in situ on the MXene surface and interlayers through coordination-driven self-assembly, forming a MXene/MOF precursor. [68]
- Derivation via Pyrolysis: The MXene/MOF precursor is subjected to high-temperature pyrolysis (e.g., 600 °C for 2 hours) under an inert argon atmosphere. This process converts the MOF component into a porous carbon-based matrix embedded with metal species (e.g., CoS nanoparticles), resulting in the final MXene/MOF-derived composite. [68]
Fabrication of 3D-Structured Graphene Anodes
Innovative fabrication techniques are crucial for overcoming the limitations of traditional graphene production methods.
- PES-rGO Sheet Fabrication: A Polyethersulfone (PES) and reduced Graphene Oxide (rGO) composite sheet is fabricated using a cost-effective doctor-blade coating technique. The mixture is coated onto a substrate and subsequently peeled off using a natural water peel-off process, yielding a free-standing, fully conductive PES-rGO sheet. [69]
- Laser-Induced Graphene (LIG) Hybridization: The PES-rGO sheet is securely affixed to a platform and engraved on both top and bottom surfaces using a CO₂ laser system. This process converts the PES polymer within the sheet into porous 3D graphene, thereby hybridizing the rGO with LIG (forming PES-rGO-LIG) and creating a highly dense, conductive 3D network. [69]
- Electrode Preparation and Cell Assembly: The optimized PES-rGO-LIG sheet is punched into electrodes and dried under vacuum. For half-cell testing, electrodes are assembled into coin cells in an argon-filled glovebox using lithium metal as the counter/reference electrode, a standard organic electrolyte (e.g., 1 M LiPF₆ in EC/DEC), and a separator. [69]
Conversion of Waste Plastics to Functional Carbons
Transforming waste plastics into carbon materials offers a sustainable pathway for material sourcing.
- Feedstock Preparation: Waste plastics like polyethylene (PE), polypropylene (PP), polyethylene terephthalate (PET), and polyvinyl chloride (PVC) are collected, sorted, and cleaned to remove impurities. [72]
- Conventional Pyrolysis: The waste plastic is placed in a quartz boat within a tube furnace. It is then heated to a high temperature (e.g., 400-900 °C) under an inert atmosphere (N₂ or Ar) for a specified duration (minutes to hours). This thermal decomposition process converts the plastic into carbonaceous material. [72]
- Catalytic Pyrolysis: To enhance the quality or yield of specific carbon forms (like carbon nanotubes), a catalyst (e.g., Ni, Fe, or Co-based) is mixed with the plastic feedstock before pyrolysis. [72]
- Emerging Techniques - Flash Joule Heating: The waste plastic is mixed with a carbon black conductor and placed between two electrodes in a reaction chamber. A short, intense pulse of electricity (e.g., ~500 V) is applied, rapidly heating the material to high temperatures (~3000 K) in milliseconds, instantly converting it to graphene. [72]
- Post-Processing: The resulting carbon material may undergo activation (e.g., with KOH or CO₂ at high temperatures) to increase its specific surface area and porosity, making it more suitable for supercapacitor applications. [72]
Research Reagent Solutions and Essential Materials
Selecting appropriate reagents and materials is fundamental to the successful synthesis and performance of these advanced energy storage materials.
Table 3: Essential Research Reagents and Materials for Energy Storage Material Synthesis
| Reagent/Material | Function/Application | Example Use Case |
|---|---|---|
| MAX Phase (e.g., Ti₃AlC₂) | Precursor for MXene synthesis | Source for producing Ti₃C₂Tₓ MXene via selective etching. [68] |
| Hydrofluoric Acid (HF) or HCl/LiF mixture | Etchant for MXene synthesis | Selectively removes the 'A' layer from the MAX phase. [68] |
| Zirconyl Chloride (ZrOCl₂), Terephthalic Acid | Metal node and organic linker for MOF synthesis | Reactants for constructing UiO-66 MOF structure. [73] |
| 2-Methylimidazole, Cobalt Nitrate (Co(NO₃)₂) | Ligand and metal source for MOF synthesis | Reactants for synthesizing ZIF-67 MOF on MXene scaffolds. [68] |
| Graphite Powder | Starting material for graphene oxide | Used in modified Hummers' method to produce GO. [69] |
| Polyethersulfone (PES) | Polymer binder and carbon precursor | Serves as a substrate and is converted to LIG in composite graphene sheets. [69] |
| Waste Plastics (PE, PP, PET, PVC) | Sustainable feedstock for carbon material synthesis | Source material for pyrolysis or Flash Joule Heating to produce carbon nanotubes, porous carbon, etc. [72] |
| N-Methyl-2-pyrrolidone (N-Methylpyrrolidone) | Solvent for MXene dispersion | Used for storing and delaminating MXene to prevent oxidation. [68] |
| Lithium Hexafluorophosphate (LiPF₆) | Salt for electrolyte formulation | Standard conducting salt in organic electrolytes for Li-ion and Li-ion capacitor testing. [70] [69] |
| Ethylene Carbonate (EC) / Diethyl Carbonate (DEC) | Solvent system for electrolyte | Common organic solvent mixture for battery/capacitor electrolytes. [69] |
Performance and Pathway Visualization
The following diagram illustrates the logical relationship between the core material classes, their primary synthesis pathways, and their resulting contributions to key performance metrics in energy storage devices, particularly highlighting the pathway to achieving high energy density.
Material Pathways to Performance. This diagram maps the synthesis routes and key properties of four material classes that contribute to high energy density in energy storage devices. Composite strategies, such as combining MXenes and MOFs, leverage synergistic effects to simultaneously enhance multiple properties.
The global transition to renewable energy and electrified transportation has intensified the search for advanced energy storage solutions that can simultaneously meet high energy and high-power demands. Traditional energy storage devices often face a fundamental trade-off: batteries offer high energy density but limited power density and cycle life, whereas supercapacitors provide high power density and virtually unlimited cycle life but store less energy. Hybrid system architectures that combine capacitors with batteries are emerging as a transformative engineering solution to this challenge, designed to bridge the energy-power divide and enhance overall system performance [74].
These hybrid systems leverage the complementary strengths of both technologies. The battery component serves as the high-energy source, ensuring sustained operation, while the capacitor acts as a high-power reservoir, efficiently handling peak power demands, rapid charging, and regenerative braking events. This synergy is particularly critical in applications with highly dynamic load profiles, such as electric vehicles (EVs), renewable energy integration, and grid frequency stabilization [74] [75]. By mitigating the stress on batteries during high-current operations, the hybrid architecture directly addresses key limitations including limited cycle life, slow response times, and reduced efficiency under pulsed loads. This guide provides a comparative assessment of these hybrid architectures, focusing on their performance metrics, underlying experimental methodologies, and implementation frameworks for research and development.
Performance Comparison of Hybrid Architectures
Quantitative comparison reveals how different hybrid configurations balance energy density, power density, and cycle life. The following table synthesizes experimental data from recent studies on prominent hybrid systems.
Table 1: Performance Metrics of Hybrid Capacitor-Battery Systems
| Technology / Configuration | Energy Density (Wh/kg) | Power Density (W/kg) | Cycle Life (cycles) | Key Characteristics |
|---|---|---|---|---|
| Lithium-Ion Hybrid Capacitor (with 3D Graphene) | 115.58 | 396.00 | 86.4% capacity after 600 cycles | Achieves LIB-level energy density; uses 3D graphene nanoflakes as conductive additive [76]. |
| Generic Hybrid Li-ion/Supercapacitor | >100 | >1000 | >10,000 | Combines Li-ion capacity with supercapacitor power and cycle life [74]. |
| Battery-Supercapacitor HESS (for EVs) | Varies with battery type | Varies with battery type | Significant improvement vs. battery-only | Reduces battery stress, improves lifetime, maximizes regenerative braking recovery [74]. |
| Skeleton Technologies "SuperBattery" | Not Specified | Not Specified | Extremely high | 15-second charge capability; uses patented "Curved Graphene" [74]. |
The data indicates that Lithium-Ion Hybrid Capacitors (LIHCs), particularly those enhanced with advanced materials like 3D graphene nanoflakes, are capable of achieving energy densities that begin to rival traditional lithium-ion batteries while maintaining the high power and long cycle life characteristic of capacitors [76]. This makes them a particularly promising architecture. Furthermore, generic hybrid systems consistently demonstrate the ability to surpass 10,000 cycles, a significant improvement over the typical cycle life of standard lithium-ion batteries, underscoring the durability benefits of hybridization [74].
Experimental Protocols and Methodologies
A critical step in advancing hybrid energy storage systems involves the synthesis of novel materials and the precise fabrication and testing of laboratory-scale devices. The following experimental workflow outlines a representative methodology for creating and evaluating a advanced Lithium-Ion Hybrid Capacitor (LIHC), based on a recent study.
Diagram 1: LIHC Fabrication and Test Workflow
Detailed Experimental Protocols
Material Synthesis: Plasma-Enhanced CVD of 3D Graphene Nanoflakes
The synthesis of three-dimensional graphene nanoflakes (GNFs) is a key step for enhancing electrode performance. The following protocol is adapted from a study that achieved significant performance gains [76].
- Objective: To synthesize highly conductive, defect-rich, and hydrophilic 3D graphene structures at low temperatures without toxic gases or metal catalysts.
- Equipment & Setup: A home-made microwave plasma-enhanced chemical vapor deposition (PECVD) system is used. Key components include:
- A quartz reaction tube.
- A microwave plasma source (e.g., SAIREM's GMS 200) with an Evenson cavity.
- Mass flow controllers for gases.
- A non-contact infrared thermometer for temperature monitoring.
- Procedure:
- Substrate Preparation: Clean copper foils (1.3 cm x 0.8 cm) sequentially in ultrasonic baths of acetone, methanol, and isopropanol for 10 minutes each. Dry with nitrogen gas.
- Reactor Loading: Place the flattened copper foils on a quartz holder and transfer them into the quartz tube.
- System Purge: Flush the tube with argon gas (100 SCCM) for 20 minutes, then pump down to a base pressure of 1.6 x 10⁻² Torr.
- GNF Growth: Introduce the precursor gases with a flow ratio of 10:2:5 (CH₄:Ar:H₂ in SCCM). Maintain a chamber pressure of ~0.5 Torr.
- Plasma Ignition: Ignite the plasma at a power of 60 W per sample. The Evenson cavity should be positioned close (~8 mm) to the copper foil to create an energetic environment for defect formation and 3D growth. No active heating is required.
- Synthesis Duration: Maintain growth conditions for 10 minutes.
- Product Collection: After synthesis, introduce argon to return the chamber to atmospheric pressure. The final 3D GNF powder is collected by gently scraping it from the copper foil surface.
- Material Characterization: The synthesized GNFs should be characterized using:
- Raman Spectroscopy: To confirm the structure and defect density (D and G bands).
- FIB-SEM and TEM: To analyze the 3D morphology and open network structure.
- XPS: To determine surface composition and chemistry.
Electrode Fabrication and Cell Assembly for LIHCs
This protocol details the construction of a coin-cell LIHC, integrating the synthesized GNFs as a conductive additive [76].
- Objective: To fabricate and assemble a LIHC coin cell with optimized electrode composition for testing.
- Electrode Formulation:
- Anode: Activated Carbon (AC) based slurry.
- Cathode: A mixture of AC and LiFePO₄ (LFP) in a weight ratio of 6.6:1.
- Conductive Additive: Integrate the synthesized GNFs (e.g., at 2.5 wt%) into the electrode slurry. Comparative cells can be made using commercial additives like Carbon Black (Super P).
- Slurry Preparation: The active materials (AC, LFP), conductive additive (GNFs), and a polymer binder (e.g., PVDF) are mixed in a suitable solvent (e.g., N-Methyl-2-pyrrolidone, NMP) to form a homogeneous slurry.
- Cell Assembly in Coin Cell Configuration:
- Electrode Coating: The slurry is coated onto a current collector (e.g., aluminum foil) and dried under vacuum.
- Electrode Cutting: Punching the coated foil into precise discs.
- Stacking in Glovebox: In an argon-filled glovebox, the cell is stacked in the order: cathode, separator soaked with electrolyte, anode.
- Electrolyte: A lithium-ion conducting organic electrolyte (e.g., 1 M LiPF₆ in EC/DEC) is used.
- Cell Sealing: The stack is placed in a coin cell casing and hermetically sealed under pressure.
Electrochemical Performance Evaluation
This protocol standardizes the testing of the assembled hybrid devices to obtain comparable performance data.
- Objective: To quantitatively evaluate the capacity, energy density, power density, and cycle life of the assembled LIHC.
- Test Equipment: Battery cycler or potentiostat/galvanostat.
- Procedure:
- Cyclic Voltammetry (CV): To analyze charge storage mechanisms (capacitive vs. battery-like behavior) and electrochemical stability.
- Galvanostatic Charge-Discharge (GCD): The primary test for determining capacity, energy efficiency, and cycle life. Tests are performed at various current densities (e.g., from 0.05 A g⁻¹ to 1 A g⁻¹).
- Capacity Calculation: Calculated from the discharge curve using the formula: Capacity (mAh/g) = (I × Δt) / (3.6 × m), where I is current (A), Δt is discharge time (s), and m is the active mass of the electrode (g).
- Energy Density Calculation: Calculated as Energy (Wh/kg) = (I × ∫V dt) / (3.6 × m), where ∫V dt is the area under the discharge curve.
- Cycle Life Testing: The cell is charged and discharged for hundreds or thousands of cycles at a specified current density. The capacity retention percentage is reported after a set number of cycles (e.g., 86.4% after 600 cycles) [76].
- Electrochemical Impedance Spectroscopy (EIS): Performed before and after cycling to assess changes in internal resistance.
System Architectures and Control Strategies
The physical integration of batteries and capacitors is only one aspect of a hybrid system. The electrical architecture and the control strategy that governs the power flow between components are equally critical for realizing performance gains. The following diagram illustrates a high-level control logic for a grid-scale Hybrid Energy Storage System (HESS).
Diagram 2: HESS Control Logic
Hybrid Configuration Topologies
Research and commercial implementations typically follow several key topologies [74]:
- Passive Parallel: The simplest configuration, where the battery and supercapacitor are directly connected in parallel without any power electronics. This architecture is low-cost but offers no independent control, limiting performance optimization.
- Semi-Active (Battery or Capacitor Side Converter): A power converter is placed on either the battery or the capacitor branch. This allows for better current management of the converted component, reducing stress and improving efficiency. This is a common cost-performance compromise.
- Fully Active (Dual-Side Converters): Both the battery and the supercapacitor are connected to the common DC bus through their own bi-directional DC-DC converters. This architecture offers the highest degree of control, allowing the system to precisely define the power setpoint for each device based on its strengths. Advanced energy management strategies (e.g., frequency-decoupling, fuzzy logic, model predictive control) are implemented here [74] [75].
Advanced Control Strategies
An advanced control strategy is vital for dynamically splitting power demands between the battery and capacitor. A 2025 study proposed a cascaded Proportional Derivative-Proportional Integral (PD-PI) controller, optimally tuned with a bio-inspired algorithm, for grid frequency stability [75]. In this strategy:
- The supercapacitor or SMES handles rapid, short-duration frequency deviations, acting as a power shock absorber [75].
- The battery or Plug-in Electric Vehicles (PEVs) manage the longer-term, sustained energy imbalances [75].
- The proposed PD-PI controller was shown to improve system performance by 55% compared to using only SMES and by 45% compared to using only PEVs, demonstrating the profound benefit of a well-managed hybrid architecture [75].
The Scientist's Toolkit: Essential Research Reagents and Materials
The development and testing of hybrid capacitor-battery systems rely on a suite of specialized materials and reagents. The following table details key components used in the featured experiments and broader research contexts.
Table 2: Essential Research Reagents and Materials for Hybrid System Development
| Material / Reagent | Function / Role | Specific Examples & Notes |
|---|---|---|
| Activated Carbon (AC) | Primary capacitive electrode material with a very high specific surface area for electrostatic charge storage. | ACS20; commonly used as the anode material in LIHCs [76]. |
| Lithium Iron Phosphate (LFP) | Battery-type cathode material providing high theoretical specific capacity via lithium-ion intercalation/deintercalation. | UBIQ Tech.; offers safety and cycle life [76]. |
| 3D Graphene Nanoflakes (GNFs) | Conductive additive; its 3D network enhances electron transport, structural stability, and hydrophilicity in the electrode. | Synthesized via PECVD; superior to Carbon Black (Super P) in boosting capacity and energy density [76]. |
| Carbon Black (e.g., Super P) | Standard conductive additive for comparison; provides electrical connectivity between active material particles. | A common benchmark in experimental studies to validate new additives [76]. |
| Polyvinylidene Fluoride (PVDF) | Binder; ensures mechanical integrity of the electrode film and adhesion to the current collector. | Dissolved in NMP solvent for slurry preparation. |
| Lithium Hexafluorophosphate (LiPF₆) | Salt in the organic electrolyte, providing lithium ions for ionic conductivity. | Typically used at 1 M concentration in organic solvents [76]. |
| Organic Solvent Blends | Electrolyte solvent; determines operating voltage window and stability. | Ethylene Carbonate/Diethyl Carbonate (EC/DEC) is a common mixture [76]. |
| Polyolefin Membrane | Separator; electrically isolates the electrodes while allowing ionic passage. | Celgard is a widely used commercial example. |
| Curved Graphene | Advanced carbon material for next-generation hybrid capacitors. | Patented material used in Skeleton Technologies' "SuperBattery" [74]. |
| Nitroxide-Polymer (e.g., PTMA) | Redox-active material for hybrid supercapacitor electrodes. | Can be hybridized with LFP to create electrodes with enhanced power and cycling stability [74]. |
The systematic comparison and experimental data presented in this guide affirm that hybrid capacitor-battery architectures are a potent strategy for overcoming the inherent limitations of standalone energy storage devices. The integration of advanced materials, such as 3D graphene nanoflakes, pushes the performance envelope, enabling devices like Lithium-Ion Hybrid Capacitors to achieve energy densities rivaling batteries while retaining the high power and longevity of capacitors [76]. Furthermore, sophisticated control strategies, such as the optimized PD-PI controller, are proving essential for maximizing system-level benefits, including enhanced frequency regulation and prolonged battery cycle life [75].
Future research is directed toward several key frontiers. The exploration of novel 2D materials and composite electrodes will continue to enhance both energy and power densities. The development and scale-up of solid-state electrolytes promise to further improve safety and performance boundaries [77]. For system-level implementation, the creation of more intelligent, adaptive energy management systems using machine learning will be crucial for optimizing performance in real-world, dynamic applications. Finally, as the industry scales, sustainable and scalable manufacturing processes for key materials like graphene, alongside robust recycling protocols for hybrid systems, will be imperative for ensuring the economic and environmental viability of these advanced energy storage solutions [77].
Supercapacitors, or ultracapacitors, represent a class of energy storage devices that effectively bridge the performance gap between traditional electrolytic capacitors and rechargeable batteries. They are characterized by rapid charging and discharging capabilities, high-power density, and long operational lifespans, often enduring millions of charge-discharge cycles [78]. The global supercapacitor market, valued at USD 4.44 billion in 2024, is projected to exhibit a robust CAGR of 17.9% through 2032, underscoring their growing industrial importance [78].
The evaluation of energy density is central to supercapacitor research and application. The fundamental equation governing the stored energy (E) in a capacitor is: E [Ws] = 0.5 · C [F] · U² [V²] [1] Where C is the capacitance and U is the operating voltage. This equation reveals that strategies for enhancing energy density primarily focus on increasing the device's capacitance or expanding its operational voltage window [1].
Industrial supercapacitors are predominantly categorized into three types, each with distinct material compositions and performance trade-offs [37]:
- Electric Double-Layer Capacitors (EDLCs): The most mature technology, using carbon-based electrodes to store charge electrostatically. They offer high power density and cycle life but have lower energy density [37].
- Pseudocapacitors: Utilize metal oxides or conducting polymers to store charge through fast, reversible surface redox reactions. They offer higher energy density than EDLCs but often at the cost of reduced power density and cycle life, and remain in early stages of commercialization [37] [79].
- Hybrid Supercapacitors: Combine capacitive electrodes with battery-like electrodes (e.g., lithium-ion), aiming to balance the high energy of batteries with the high power and longevity of supercapacitors. They offer moderate power density and cycle life with higher energy density, though at a higher cost [37].
Performance Comparison of Supercapacitor Technologies
The following table provides a quantitative comparison of these supercapacitor types against other common energy storage technologies, highlighting key performance metrics critical for application selection.
Table 1: Performance comparison of energy storage technologies
| Technology | Energy Density (Wh/kg or Wh/L) | Power Density (kW/kg or kW/L) | Cycle Life (thousands) | Key Strengths | Key Weaknesses |
|---|---|---|---|---|---|
| EDLCs | ~7-10 Wh/L (Device Level) [1] | ~30 kW/L (Device Level) [1] | >1,000 [37] | Very high power density, excellent cycle life, low cost/W [37] | Low energy density, high cost/Wh [37] |
| Pseudocapacitors | Moderate (Between EDLC and Hybrid) [37] | Lower than EDLC [37] | Lower than EDLC [37] | Higher energy density than EDLCs [79] | Lower power density and cycle life; early-stage development [37] |
| Hybrid Supercapacitors | Moderate to High [37] | Moderate [37] | Moderate [37] | Higher energy density; balances battery and capacitor properties [37] | High cost; relies on battery materials [37] |
| Li-ion Batteries | High (>>10 Wh/kg) [37] | Low (<<1 kW/L) [37] | 0.5-10 [37] | High energy density [37] | Lower power density, limited cycle life, contains critical materials [37] [1] |
| Conventional Capacitors | Very Low [37] | Very High [37] | Essentially Infinite [37] | Extremely high power density [37] | Very low energy density [37] |
Analysis of Performance Gaps and Application Niches
The data illustrates that supercapacitors occupy a specific niche, unsuitable as a direct replacement for batteries in high-energy applications but superior for roles requiring high power bursts, rapid cycling, and long operational life [37]. For instance, while a Li-ion battery may power a device for hours, a supercapacitor is better suited to provide a high-power pulse for camera flash or absorb regenerative braking energy in vehicles [37]. The primary weakness of supercapacitors remains their low energy density, which has seen only incremental improvement in commercial devices over the past two decades, from ~7 Wh/L in 2002 to ~10-16 Wh/L in recent years [1]. This stagnation, despite promising academic research, points directly to the manufacturing and scalability challenges explored in this guide.
Manufacturing Challenges and Scalability Analysis
The transition from laboratory research to industrial-scale production of high-performance supercapacitors is fraught with obstacles. A significant "information gap" exists between academia and industry, where promising research outcomes often fail to meet the multifaceted demands of commercial manufacturing [1].
Core Manufacturing Challenges and Bottlenecks
The journey from a novel material to a commercially viable supercapacitor involves navigating a complex landscape of cost, supply chain, and production constraints.
Diagram 1: Supercapacitor manufacturing challenge workflow.
The workflow in Diagram 1 highlights critical bottlenecks:
- Material-Centric Bottlenecks: Many high-performance materials, such as specific graphene formulations or advanced metal-organic frameworks (MOFs), face prohibitive synthesis costs and cannot be produced in the volumes required for mass production [1]. For example, while "Curved Graphene" has enabled a device with 16 Wh/L, such breakthroughs are rare and slow to market [1].
- Electrode Processing Limitations: Industrial electrodes typically use aluminum foil current collectors coated with a mixture of microporous carbon, conductive additives, and binders. Research often focuses solely on the active carbon material, neglecting the cost and processing challenges associated with coating, drying, and calibrating the electrode to the precise thickness and density required for high-speed winding machines [1].
- Electrolyte and Voltage Challenges: While academic research frequently reports devices operating at voltages over 4.0 V using novel electrolytes, industrial devices have only incrementally increased from 2.5 V to 3.0 V. This is because industrial producers prioritize factors beyond just voltage, such as electrolyte ionic conductivity (which governs power density), long-term stability, safety, and cost-effectiveness [1]. A novel electrolyte with a high operating voltage but low conductivity or high cost has little innovation potential for commercial applications [1].
Cost Analysis and Supply Chain Considerations
The supercapacitor supply chain involves several critical materials. The cost per unit of energy stored (cost/Wh) for supercapacitors remains an order of magnitude greater than that of lithium-ion batteries, despite a favorable cost per unit of power (cost/W) [37]. This metric is a primary restraint for broader adoption.
Table 2: Key materials and supply chain elements in supercapacitors
| Material / Component | Function | Common Types | Scalability & Cost Challenges |
|---|---|---|---|
| Electrode Material | Primary charge storage medium | Activated carbon, carbon black, graphene, metal oxides, conducting polymers [79] | High-surface-area carbons are standard; cost of graphene/MOFs is high; supply of high-purity precursors can be volatile. |
| Current Collector | Conducts electrons to/from electrode | Aluminum foil [1] | Thickness reduction is a key strategy for improving energy density [1]; supply is generally stable. |
| Electrolyte | Medium for ion transport between electrodes | Aqueous, organic (Acetonitrile-based), ionic liquids [37] [1] | Purity is critical for voltage window; acetonitrile has safety concerns [37]; novel salts may have high molar weight, increasing cost [1]. |
| Separator | Prevents electrical short between electrodes | Cellulose-based, polymer films [37] | Must be thin and porous; thickness reduction is a primary design optimization route [1]. |
A top-down analysis of industrial devices reveals that manufacturers often prioritize incremental design optimizations over revolutionary material changes because the former requires less effort and cost. Common strategies include:
- Decreasing the thickness of the aluminum current collector and separator to pack more active material into the same volume [1].
- Increasing the density or loading (weight per area) of the carbon coating on the electrodes [1]. These approaches can yield significant energy density gains (e.g., 5-15%) without the need to re-qualify new active materials or overhaul the supply chain, thereby mitigating scalability risks [1].
Experimental Protocols for Performance Evaluation
To objectively compare supercapacitor technologies, standardized testing protocols are essential. The following methodologies are critical for evaluating the claims of both established and emerging devices.
Protocol for Cyclic Voltammetry (CV) Analysis
Objective: To determine the capacitance and analyze the charge storage mechanism (capacitive vs. pseudocapacitive) of a supercapacitor cell.
- Cell Setup: Assemble a two-electrode test cell using the prepared electrodes, separator, and electrolyte in a controlled, moisture-free environment (e.g., an argon-filled glovebox).
- Instrumentation: Use a potentiostat/galvanostat system.
- Procedure: Apply a linear voltage sweep across the cell within its stable operating voltage window (e.g., 0.0 to 2.7 V for an organic electrolyte EDLC). Use multiple scan rates (e.g., from 1 mV/s to 100 mV/s).
- Data Analysis:
- Capacitance Calculation: For a rectangular CV curve, the capacitance (C) is calculated from the formula:
C = i / (dU/dt), whereiis the average current and(dU/dt)is the scan rate. More precisely, the specific capacitance is calculated by integrating the area under the CV curve to find the charge (Q), then usingC = Q / (ΔU * m), whereΔUis the voltage window andmis the mass of the active material on both electrodes. - Mechanism Insight: A perfectly rectangular CV indicates ideal double-layer behavior. Peaks or deviations from the rectangle suggest the presence of pseudocapacitance from faradaic reactions.
- Capacitance Calculation: For a rectangular CV curve, the capacitance (C) is calculated from the formula:
Protocol for Galvanostatic Charge-Discharge (GCD) Testing
Objective: To measure capacitance, energy density, power density, and cycle life with high accuracy.
- Cell Setup: Identical to the CV test setup.
- Instrumentation: Use a battery cycler or a potentiostat with a high-current channel.
- Procedure: Charge the cell to its maximum voltage at a constant current, hold at that voltage until the current decays to a set threshold (e.g., C/20), then discharge at the same constant current to the minimum voltage. This constitutes one cycle. Repeat for thousands of cycles to assess longevity. Perform this at various current densities (e.g., from 0.1 A/g to 10 A/g).
- Data Analysis:
- Capacitance Calculation:
C = (i * Δt) / ΔU, whereiis the discharge current,Δtis the discharge time, andΔUis the discharge voltage range (excluding the IR drop). - Energy Density (E):
E = 0.5 * C * (ΔU)² - Power Density (P):
P = E / Δt - Cycle Life: Plot the capacitance retention (%) versus cycle number.
- Capacitance Calculation:
Protocol for Electrochemical Impedance Spectroscopy (EIS)
Objective: To deconvolute the internal resistance (ESR) and frequency response of the supercapacitor.
- Cell Setup: Identical to the CV test setup.
- Instrumentation: Use a potentiostat with a frequency response analyzer.
- Procedure: Apply a small AC voltage amplitude (e.g., 5-10 mV) over a wide frequency range (e.g., 100 kHz to 10 mHz) at the open-circuit potential.
- Data Analysis: Fit the resulting Nyquist plot to an equivalent circuit model (typically a resistor in series with a constant phase element). The high-frequency real-axis intercept gives the Equivalent Series Resistance (ESR), a critical parameter for power performance.
The Scientist's Toolkit: Essential Research Reagents and Materials
Table 3: Key reagents and materials for supercapacitor R&D
| Item | Function in R&D | Critical Parameters & Notes |
|---|---|---|
| High-Surface-Area Carbon | The active material for EDLCs; provides surface for electrostatic charge storage. | BET Surface Area (>1500 m²/g), Pore Size Distribution (micropores vs. mesopores), Electrical Conductivity. Pore size must be optimized for the specific electrolyte ions [1]. |
| Transition Metal Oxide (e.g., RuO₂, MnO₂) | Active material for pseudocapacitors; enables charge storage via surface redox reactions. | Specific Capacitance, Crystallinity, Electrical Conductivity. RuO₂ offers high performance but is costly; MnO₂ is more economical but less conductive [79]. |
| Conducting Polymer (e.g., PEDOT:PSS, Polyaniline) | Active material for pseudocapacitors; stores charge through doping/de-doping processes. | Electrical Conductivity, Electrochemical Stability, Processability. Can suffer from swelling/shrinkage during cycling, reducing longevity [79]. |
| Organic Electrolyte (e.g., TEABF₄ in Acetonitrile) | Provides ions for charge transport; defines the operational voltage window of the cell. | Electrochemical Stability Window (>2.5 V), Ionic Conductivity, Purity (H₂O < 10 ppm). Acetonitrile offers high conductivity but poses safety concerns; propylene carbonate is a safer alternative [37] [1]. |
| Celgard or Cellulose Separator | Electrically isolates the electrodes while allowing ionic transport. | Thickness, Porosity, Pore Size, Mechanical Strength, Electrochemical Inertness. Thinner separators improve energy density but increase short-circuit risk [1]. |
| Carbon Black (e.g., Super P) | Conductive additive in electrode slurry; improves electron transport within the electrode. | Particle Size, Surface Area, Dispersion Quality. Typically constitutes 5-10% of the electrode dry mass. |
| Polyvinylidene Fluoride (PVDF) or Carboxymethyl Cellulose (CMC) | Binder; holds the active material and conductive additive together on the current collector. | Adhesion Strength, Electrochemical Stability, Solubility (NMP for PVDF, Water for CMC). CMC is a lower-cost, water-soluble alternative. |
| Aluminum Foil Current Collector | Provides a low-resistance path for electrons to travel to the external circuit. | Thickness (often 20-30 µm), Purity, Surface Roughness. Thinner foils are a target for energy density gains [1]. |
The path to overcoming the manufacturing and scalability challenges in the supercapacitor industry requires a concerted effort to bridge the gap between academic research and industrial production. While material science research continues to push the boundaries of performance in metrics like energy density, successful innovation must be evaluated through a broader lens that includes cost, supply chain stability, and compatibility with existing manufacturing infrastructure. The most impactful near-term advancements will likely continue to come from incremental, top-down optimizations of cell design and manufacturing processes. However, a deeper collaboration between research and industry, with a shared focus on the metrics that truly count for commercial application, is essential for triggering the step-change improvements needed to expand the role of supercapacitors in the global energy storage landscape.
Thermal Management and Lifetime Optimization for Harsh Operating Environments
In the context of a broader thesis evaluating the energy density of different capacitor types, effective thermal management and lifetime optimization emerge as pivotal concerns, particularly for operation in harsh environments. Harsh operating environments, characterized by extreme temperatures, thermal cycling, high electrical stress, and mechanical vibrations, can severely degrade capacitor performance and longevity. These challenges are especially critical in applications such as aerospace, automotive, oil and gas exploration, and renewable energy systems, where reliability is paramount [80] [81]. Different capacitor technologies exhibit vastly different behaviors under thermal stress, influencing both their immediate performance in energy storage applications and their long-term reliability.
The failure mechanisms activated by high temperatures are primarily tied to the degradation of internal materials. For electrolytic capacitors, electrolyte evaporation is a dominant failure mode [82]. For ceramic capacitors, issues relate to dielectric aging and insulation resistance degradation [83], while polymer capacitors face challenges related to the glass transition of dielectric films [80]. Understanding these fundamental relationships between temperature, material science, and failure physics is essential for selecting the right capacitor technology and implementing effective lifetime optimization strategies for demanding applications. This guide objectively compares the performance of major capacitor classes under thermal stress, supported by experimental data and detailed methodologies.
Performance Comparison of Capacitor Technologies
Table 1: Performance Comparison of Capacitor Technologies for Harsh Environments
| Capacitor Technology | Typical Operating Temp. Range | Key Strengths | Key Limitations | Typical Failure Mechanisms |
|---|---|---|---|---|
| NanoLam Thermoset Polymer [80] | -196°C to +160°C | High energy density, excellent self-healing, radiation resistance, stable ESR over temperature | Moisture sensitivity at high temperatures, encapsulation challenges beyond 160°C | Electrode corrosion, encapsulation breakdown |
| Multilayer Ceramic (MLCC - Lead-Free) [83] | Up to 350°C (component dependent) | High mechanical strength, excellent temperature stability, high insulation resistance | DC bias characteristics, can be prone to micro-cracks under thermal shock | Degradation of dielectric properties, crack propagation |
| Aluminum Electrolytic (Al-Cap) [82] [84] | Typically -40°C to +105°C (extended ranges available) | High capacitance per volume, cost-effective for high capacitance values | Limited lifetime, high ESR at low temperatures, sensitivity to ripple current | Electrolyte vaporization (dry-out), increased ESR, capacitance loss |
| Hybrid Supercapacitor [85] | -40°C to +85°C (varies with current) | Very high power density, rapid charge/discharge | Lower energy density vs. batteries, high self-discharge | Increased internal resistance, pressure build-up |
Table 2: Quantitative Performance Data from Experimental Studies
| Capacitor Technology | Reported Energy Density | Key Thermal & Lifetime Experimental Findings | Test Conditions / Methodology |
|---|---|---|---|
| Advanced PbO-Free MLCC [86] | 18 J/cm³ | World-record energy density and 93% discharge efficiency; stable from 20-160°C; breakdown strength of 1000 kV/cm. | Rigorous testing for frequency (0.01-100 Hz), temperature stability, and fatigue (1-10⁴ cycles). |
| NanoLam Thermoset Polymer [80] | Not Explicitly Quantified | Stable capacitance, ESR, and dissipation factor over 100 hours at -196°C (liquid nitrogen); operates up to 160°C. | Extended testing under liquid nitrogen immersion and high-temperature operational tests. |
| Hybrid Supercapacitor [85] | Varies with electrode thickness | Temperature rise is most sensitive to ambient temperature and charge-discharge current; power density decreases with increased heat production. | 3D electrothermal coupling model validated with constant-current discharge experiments in a controlled bath. |
| Aluminum Electrolytic [82] | Not a primary metric | B10 lifetime distribution calculated considering uncertain mission profiles (ambient temperature, operating time). | Mission profile uncertainty modeled with kernel density estimation; lifetime predicted via Monte Carlo simulation. |
Experimental Protocols for Thermal and Lifetime Analysis
Protocol 1: Mission Profile-Based Lifetime Prediction for Aluminum Electrolytic Capacitors
This methodology focuses on predicting capacitor lifetime under real-world, variable conditions, moving beyond idealized lab tests [82].
- Objective: To optimize the lifetime of aluminum electrolytic capacitors (Al-Caps) by accounting for uncertainties in real-world operating conditions, such as fluctuating ambient temperature and varying load cycles.
- Procedure:
- Mission Profile Modeling: Collect historical weather and operational data (e.g., for an LED street light). Model the uncertainties in ambient temperature and daily operating time using statistical methods like kernel density estimation.
- Thermal Stress Analysis: Use both thermal simulation and experimental measurements to determine the core temperature of the Al-Cap under the various operating conditions defined by the mission profile. The core temperature is the primary driver of degradation.
- Monte Carlo Simulation: Run a large number of simulated life cycles using the mission profile model. For each cycle, calculate the resulting B10 lifetime (the time at which 10% of the capacitor population is expected to have failed).
- Reliability Optimization: Establish an optimization formulation that integrates both the average and standard deviation of the B10 lifetime distribution. Use an optimization algorithm, such as the particle swarm optimization (PSO) algorithm, to find the capacitor design parameters that maximize robustness and lifetime.
- Key Measurements: Core temperature swing, calculated B10 lifetime distribution, optimized design parameters.
Protocol 2: Electrothermal Coupling Analysis of Hybrid Supercapacitors
This protocol uses a coupled model to understand the internal thermal characteristics of a hybrid supercapacitor during operation [85].
- Objective: To study the heat generation rate, internal temperature distribution, and performance of a hybrid supercapacitor during charge-discharge cycles, and to analyze the influence of parameters like ambient temperature and electrode thickness.
- Procedure:
- Model Setup: Establish a 1D electrochemical model and a 3D heat-transfer model of the hybrid supercapacitor using multiphysics simulation software (e.g., COMSOL).
- Parameter Variation: Define a set of experiments to simulate under different conditions:
- Ambient Temperature: Typically from 253.15 K (-20°C) to 373.15 K (100°C).
- Charge-Discharge Current: Multiple current rates (e.g., 1C, 2C, 5C).
- Electrode Thickness: Vary the cathode thickness while keeping the anode thickness constant.
- Coupling and Simulation: Couple the electrochemical and thermal models so that the heat generated from the electrochemical reactions influences the temperature, and the temperature, in turn, affects the electrochemical properties. Solve the coupled model during charge-discharge cycles.
- Experimental Validation: Perform constant-current discharge experiments on a physical hybrid supercapacitor placed in a constant-temperature water bath to validate the simulation results.
- Key Measurements: Internal temperature distribution (contours), heat generation rate, average State of Charge (SOC), capacitance, equivalent series resistance (ESR).
Protocol 3: High-Temperature Reliability Qualification for Semiconductor Components
This procedure is critical for validating the reliability of supporting electronics, like analog-to-digital converters (ADCs), used in harsh-environment capacitor systems [81].
- Objective: To qualify the reliability of integrated circuits (e.g., a precision ADC) for continuous operation at extreme high temperatures, focusing on packaging and performance stability.
- Procedure:
- High-Temperature Soak Testing: Subject the components to a prolonged soak at a high temperature (e.g., 195°C) for thousands of hours while under operational bias.
- Intermittent Electrical Testing: Periodically remove samples to measure key performance parameters to detect degradation. Critical metrics include integral non-linearity (INL), signal-to-noise and distortion (SINAD), and power consumption.
- Packaging Failure Analysis: Specifically inspect for failure points like wire bond integrity. This involves analyzing the bond between gold wires and aluminum bond pads for the formation of brittle AuAl intermetallic compounds, which cause failure.
- Performance Characterization: Fully characterize AC and DC performance (INL, THD, SNR) over the entire specified temperature range (e.g., -55°C to +210°C).
- Key Measurements: Cumulative failure rate over time, parametric drift in INL and SINAD, wire bond shear strength, and overall operational lifetime projection at temperature.
Diagram 1: This workflow outlines the three primary experimental protocols for analyzing capacitor performance and lifetime in harsh environments, from initial setup to final comparison and design optimization.
The Scientist's Toolkit: Key Research Reagents and Materials
Table 3: Essential Materials and Equipment for Harsh Environment Capacitor Research
| Item / Material | Function in Research | Specific Example / Application |
|---|---|---|
| BiAlO₃-modified NBT-based Ceramics [83] | Lead-free dielectric material for MLCCs; provides high dielectric constant, temperature stability, and mechanical strength via defect engineering. | Used in constructing robust MLCCs for AI servers and 5G base stations. |
| NanoLam Dielectric [80] | A solid-state nanolaminate of cross-linked thermoset polymer and nano-electrodes; enables wide temperature operation and self-healing. | Core dielectric in film capacitors for aerospace and defense applications. |
| Beta-Radiation-Cured Thermoset Polymer [80] | A highly cross-linked polymer dielectric with a high glass transition temperature (Tg ~200°C), providing dimensional and dielectric stability. | Used as the polymer layer in NanoLam capacitors to prevent brittleness at cryogenic temps. |
| Constant-Temperature Bath [85] | Provides a stable and controllable ambient temperature environment for validating electrothermal models of capacitors and supercapacitors. | Used to simulate a range of ambient temperatures (e.g., 253.15 K to 373.15 K) during discharge tests. |
| High-Temperature Rated ICs (e.g., AD7981 ADC) [81] | Enables precision data acquisition from sensors in extreme temperature environments where standard components would fail. | Signal conditioning and data conversion in downhole drilling instrumentation and avionics. |
| Over Pad Metallization (OPM) [81] | A specialized packaging process that prevents failure of wire bonds at high temperatures by inhibiting the formation of brittle intermetallics. | Critical for ensuring the reliability of plastic-packaged ICs in continuous high-temperature operation. |
The experimental data and comparisons presented in this guide underscore that there is no single superior capacitor technology for all harsh environments. The optimal choice is a careful balance of temperature resilience, lifetime requirements, energy density needs, and fundamental failure physics. NanoLam polymer capacitors offer an exceptional operating range, spanning from cryogenic temperatures up to 160°C, with superior self-healing properties [80]. Advanced lead-free MLCCs are pushing the boundaries of energy density and temperature stability beyond 300°C, making them indispensable for high-density electronics in demanding fields [83] [86]. In contrast, while aluminum electrolytic capacitors remain cost-effective for high-capacitance roles, their lifetime remains intrinsically limited by temperature and require sophisticated, probabilistic models for accurate lifetime prediction in real-world applications [82].
Future progress in this field will be driven by material science innovations and intelligent design strategies. The integration of nanomaterials, the development of graphene-based dielectrics, and the application of artificial intelligence for thermal modeling and predictive maintenance are poised to significantly enhance capacitor performance [87]. Furthermore, strategies like directional phase structure coupling with defect engineering in ceramics demonstrate a powerful approach to simultaneously optimizing multiple material properties [83]. As the demand for electronics capable of withstanding extreme conditions in electric vehicles, renewable energy, and aerospace continues to grow, the role of advanced thermal management and robust lifetime optimization will only become more critical, guiding the development of next-generation energy storage components.
Performance Benchmarking and Technology Validation Across Capacitor Types
The Ragone plot is a fundamental comparison framework in energy storage that quantifies the relationship between energy density and power density for various storage materials, devices, or systems [88]. Named after its originator, this logarithmic chart features volumetric or gravimetric energy density (in Wh/kg or Wh/L) on the vertical axis and power density (in W/kg or W/L) on the horizontal axis [88]. This visualization tool enables researchers and engineers to quickly assess the performance characteristics of different energy storage technologies, from traditional capacitors and batteries to advanced supercapacitors and fuel cells.
For capacitor technologies, positioning on the Ragone plot reveals critical performance trade-offs. Energy density represents the amount of energy a capacitor can store per unit mass or volume, while power density indicates how quickly that energy can be delivered or absorbed [89] [90]. Understanding these relationships is essential for selecting appropriate technologies for specific applications, whether prioritizing long-term energy availability or rapid burst-power delivery. This analysis systematically evaluates where different capacitor technologies reside on this spectrum, providing a scientific basis for technology selection in research and development contexts.
Fundamental Principles: Energy Density vs. Power Density
In capacitor applications, energy density and power density represent distinct but interrelated performance characteristics. Energy density focuses on storage capacity—how much total energy a device can hold—while power density measures the rate of energy transfer—how quickly that stored energy can be released or absorbed [90]. This distinction is analogous to the capacity of a fuel tank versus the speed at which fuel can be delivered to an engine.
The mathematical foundation for these metrics in capacitors begins with the basic energy storage equation. The energy (E) stored in a capacitor is calculated as:
E = ½CV²
where C represents capacitance and V represents the rated voltage [90]. From this foundation, volumetric energy density (Eᵥ) is derived by dividing the stored energy by the volume (Vol) of the device:
Eᵥ = E/Vol
Similarly, power density calculations depend on the capacitor's equivalent series resistance (ESR). The power (P) delivered by a capacitor under impedance-matched conditions (where load resistance equals ESR) can be estimated as:
P = V²/(4×ESR)
The resulting power density (Pᵥ) is then calculated as:
Pᵥ = P/Vol [90]
These relationships reveal why supercapacitors achieve higher power density than batteries: their low ESR maximizes the rate of energy transfer, enabling rapid discharge and charge cycles [90]. This fundamental understanding provides the theoretical basis for interpreting the positioning of various capacitor technologies on the Ragone plot.
Capacitor Technology Classification and Mechanisms
Electric Double-Layer Capacitors (EDLCs)
Electric Double-Layer Capacitors (EDLCs), commonly known as supercapacitors or ultracapacitors, store energy electrostatically through charge separation at the electrode-electrolyte interface [91]. This non-Faradaic process involves no transfer of charge between electrode and electrolyte, resulting in highly reversible energy storage with minimal degradation over hundreds of thousands of cycles [91] [92]. The fundamental principle involves the formation of a Helmholtz double layer at each electrode, where charges accumulate on the electrode surface while oppositely charged ions assemble in the electrolyte, separated by an atomic distance [91]. The capacitance of this double layer is given by C = Aε/4πd, where A is the electrode surface area, ε is the dielectric constant of the electrolyte, and d is the effective charge separation distance [91].
EDLCs predominantly use high-surface-area electrode materials such as activated carbons, carbon aerogels, and carbon nanotubes to maximize the interfacial area available for charge separation [91]. These devices typically employ organic electrolytes (e.g., quaternary salts in acetonitrile or propylene carbonate) that provide operating voltages up to 2.5-2.7V per cell, or aqueous electrolytes (e.g., KOH or H₂SO₄) with lower voltage ratings (~1.2V) but higher conductivity [91]. The primary advantages of EDLCs include exceptional cycle life (100,000 to 1,000,000 cycles), high power density, and rapid charging capabilities (seconds or less) [91] [92]. However, they suffer from relatively low energy density (typically 3-5 Wh/kg) compared to electrochemical batteries [91].
Pseudocapacitors
Pseudocapacitors store energy through Faradaic processes involving reversible reduction-oxidation (redox) reactions or electrosorption at the electrode-electrolyte interface [93] [91]. Unlike EDLCs, which rely solely on physical charge separation, pseudocapacitors engage in rapid, reversible electron transfer that occurs close to the electrode surface without phase transformations in the electrode material [93]. This Faradaic mechanism enables pseudocapacitors to achieve greater capacitances and energy densities than EDLCs while maintaining the characteristic high power density of supercapacitors [91].
Key pseudocapacitive materials include:
- Transition metal oxides such as RuO₂, MnO₂, Fe₃O₄, and V₂O₅ that undergo reversible redox reactions [93]
- Conducting polymers like polyaniline and polypyrrole that can be rapidly doped and dedoped [91]
- Two-dimensional materials such as MXenes and metal-organic frameworks (MOFs) with tunable surface chemistry [93]
- Intercalation-type materials including Nb₂O₅, TiO₂, and V₂O₅ that allow fast, reversible ion insertion without phase transitions [93]
Particular attention has been given to nickel-based compounds (NiO, Ni(OH)₂) and related composites due to their high theoretical capacitance, multiple valence states, natural abundance, and cost-effectiveness [93]. While pseudocapacitors bridge the gap between EDLCs and batteries in terms of energy density, they often face challenges related to limited electrical conductivity, structural instability during cycling, and more complex synthesis routes compared to carbon-based EDLCs [93].
Hybrid Capacitors
Hybrid capacitors represent a strategic approach to exploiting the relative advantages and mitigating the disadvantages of both EDLCs and pseudocapacitors [91]. These systems utilize both Faradaic and non-Faradaic processes simultaneously or in a coordinated manner to achieve performance characteristics superior to either technology alone [91]. By combining these mechanisms, hybrid capacitors achieve better energy densities than EDLCs without the significant sacrifices in cycling stability and affordability that have limited widespread adoption of pseudocapacitors [91].
Research has focused on three primary hybrid capacitor configurations:
- Composite hybrids: Integrate pseudocapacitive materials with carbon-based EDLC materials within a single electrode structure [91]
- Asymmetric hybrids: Pair one EDLC-type electrode with one pseudocapacitive or battery-type electrode in the same device [91]
- Battery-type hybrids: Combine capacitor electrodes with battery electrodes in various configurations [91]
A prominent real-world example is China's recently deployed 100 MW hybrid frequency-regulation plant, which integrates a 58 MW/30-second supercapacitor array with 42 MW/42 MWh of lithium-ion battery storage [94]. This system uses an energy management system that dynamically allocates tasks: millisecond-scale events are handled by the supercapacitor while minute-scale regulation is delivered by the battery pack [94]. This configuration extends battery lifespan and reduces lifecycle costs by approximately 30% while providing ultrafast response times of 0.001 seconds [94].
Experimental Protocols for Capacitor Characterization
Three-Electrode Cell Configuration for Material Screening
The three-electrode cell setup provides the fundamental experimental platform for evaluating individual electrode materials before full device assembly. This configuration enables accurate measurement of a single electrode's performance by controlling its potential against a stable reference electrode while using a counter electrode to complete the circuit.
Table 1: Key Research Reagent Solutions for Capacitor Electrode Fabrication
| Material Category | Specific Examples | Primary Function | Performance Considerations |
|---|---|---|---|
| High-Surface Carbon | Activated carbon (coconut shell derived), carbon aerogels, carbon nanotubes | EDLC electrode material; provides high surface area for electrostatic charge storage | Surface area (1500-3000 m²/g), pore size distribution, conductivity [95] [91] |
| Pseudocapacitive Metal Oxides | RuO₂, MnO₂, NiO, V₂O₅, Fe₃O₄ | Faradaic charge storage via surface redox reactions | Theoretical capacitance, electrical conductivity, cycling stability [93] |
| 2D Materials | MXenes (Ti₃C₂Tₓ), MOFs, COFs | Enhanced pseudocapacitance with tunable surface chemistry | Layer spacing, surface functional groups, ionic accessibility [93] |
| Conductive Polymers | Polyaniline (PANI), Polypyrrole (PPy), PEDOT | Polymer-based pseudocapacitance through doping/dedoping | Swelling/contraction stability, conductivity, potential window [91] |
| Hybrid Composites | NiO/activated carbon, MnO₂/graphene, CNT/polymer | Combine EDLC and pseudocapacitive mechanisms | Synergistic effects, interface engineering, charge balance [93] [91] |
Two-Electrode Coin Cell Assembly for Device Testing
After material characterization, promising electrodes are assembled into practical two-electrode devices for performance evaluation. The CR2032 coin cell format provides a standardized platform for supercapacitor testing under controlled conditions.
Electrode Fabrication Protocol:
- Slurry Preparation: Mix active material (80-90 wt%), conductive additive (5-10 wt% carbon black), and binder (5-10 wt% PVDF) in an appropriate solvent (NMP for PVDF)
- Current Collector Coating: Uniformly coat the slurry onto aluminum foil current collectors using a doctor blade with controlled thickness (50-200 μm)
- Drying and Compression: Dry at 80-100°C under vacuum for 12 hours, then compress electrodes at 5-10 MPa to enhance particle contact and density
- Cell Assembly: Cut electrodes to precise dimensions (typically 12-16 mm diameter), add separator (glass fiber or polypropylene), and assemble in argon-filled glove box with oxygen and moisture levels <0.1 ppm
- Electrolyte Addition: Inject precisely measured electrolyte volume (conventional organic: 1M TEABF₄ in acetonitrile; aqueous: 1M H₂SO₄ or KOH)
Electrochemical Testing Sequence:
- Formation Cycles: Begin with 5-10 cycles at low current density to stabilize the electrode-electrolyte interface
- Cyclic Voltammetry (CV): Perform at scan rates from 0.5 mV/s to 1000 mV/s to evaluate charge storage mechanisms and rate capability
- Galvanostatic Charge-Discharge (GCD): Conduct at current densities ranging from 0.1 A/g to 20 A/g to calculate capacitance and coulombic efficiency
- Electrochemical Impedance Spectroscopy (EIS): Measure from 100 kHz to 10 mHz at open circuit potential with 5-10 mV amplitude to determine internal resistance and ion transport characteristics
- Cycle Life Testing: Perform thousands of charge-discharge cycles at practical current densities to evaluate long-term performance retention
Quantitative Comparison of Capacitor Technologies
Table 2: Performance Metrics of Major Capacitor Technologies
| Technology | Energy Density (Wh/kg) | Power Density (kW/kg) | Cycle Life (cycles) | Efficiency (%) | Charge Time |
|---|---|---|---|---|---|
| Conventional Capacitors | <0.1 | Up to 100,000 | >1,000,000 | >95 | Milliseconds |
| EDLCs | 3-5 [91] | 2.5-45 [92] | 100,000-1,000,000 [91] [92] | 95-98 [92] | Seconds [92] |
| Pseudocapacitors | 5-15 [93] | 1-10 | 10,000-100,000 | 90-95 | Seconds to minutes |
| Hybrid Capacitors | 10-50 [94] [91] | 1-5 | 5,000-50,000 | 85-95 | Minutes |
| Li-ion Batteries | 100-200 [92] | 0.1-1 [92] | 300-1,000 [92] | 60-80 [92] | Hours [92] |
Table 3: Ragone Plot Positioning Parameters for Different Energy Storage Devices
| Device Type | Typical Gravimetric Energy Density (Wh/kg) | Typical Gravimetric Power Density (W/kg) | Key Characteristics | Common Applications |
|---|---|---|---|---|
| Conventional Capacitors | 0.01-0.1 | 10,000-100,000 | Very fast response, excellent cycle life | High-frequency circuits, noise filtering |
| EDLCs | 3-5 [91] | 2,500-45,000 [92] | Rapid charging, high power, long life | Regenerative braking, peak power support [95] [96] |
| Pseudocapacitors | 5-15 [93] | 1,000-10,000 | Enhanced energy density, Faradaic mechanism | Backup power, consumer electronics |
| Battery-Capacitor Hybrids | 10-50 [94] | 500-5,000 | Balanced energy-power characteristics | Grid frequency regulation [94], renewable smoothing [95] |
| Li-ion Batteries | 100-200 [92] | 150-300 [92] | High energy density, limited power | Electric vehicles, portable electronics |
The Ragone plot visualization below illustrates the characteristic positioning of each capacitor technology within the energy-power spectrum, demonstrating the performance trade-offs and complementary relationships between different storage approaches:
This Ragone plot visualization demonstrates the fundamental trade-off between energy and power densities across capacitor technologies. EDLCs occupy the high-power, low-energy region, making them ideal for applications requiring rapid burst power delivery [91] [92]. Pseudocapacitors bridge the gap between EDLCs and batteries by offering moderate improvements in energy density while maintaining relatively high power capabilities [93] [91]. Hybrid capacitors further extend this trend, achieving even higher energy densities while preserving the power characteristics that distinguish capacitors from batteries [94] [91].
Advanced Analysis: Emerging Materials and Future Directions
The development of advanced electrode materials continues to push the boundaries of capacitor performance on the Ragone plot. Pseudocapacitive materials represent a particularly promising direction, with research focusing on intercalation-type materials (Nb₂O₅, TiO₂, V₂O₅), redox-active transition metal oxides, and 2D materials like MXenes that offer fast and reversible ion insertion without phase transitions [93]. These materials enhance charge storage through surface and near-surface Faradaic reactions while maintaining the rapid kinetics characteristic of capacitive storage [93].
Nickel-based compounds (NiO, Ni(OH)₂) and related composites have emerged as particularly promising electrode materials due to their high theoretical capacitance, multiple valence states, cost-effectiveness, and environmental friendliness [93]. Their high specific capacitance, reversible redox activity, and good electrochemical stability make them suitable for high-performance energy storage systems that can bridge the gap between conventional supercapacitors and batteries [93].
Hybridization strategies represent another significant frontier in capacitor development. The successful deployment of China's 100 MW hybrid battery-supercapacitor plant demonstrates the practical potential of combining technologies to exploit their complementary strengths [94]. By integrating a 58 MW supercapacitor array with 42 MW of lithium-ion battery storage, this facility uses an intelligent energy management system to dynamically allocate millisecond-scale events to the supercapacitors while delegating minute-scale regulation to the batteries [94]. This approach extends battery lifespan, reduces lifecycle costs by approximately 30%, and enables ultrafast response times of 0.001 seconds [94].
Future research directions focus on overcoming remaining challenges in pseudocapacitive materials, including limited electrical conductivity, structural instability during cycling, and complex synthesis routes [93]. Additionally, the development of standardized testing protocols and performance metrics will enable more accurate comparisons across technologies and facilitate the rational design of next-generation electrode materials for advanced supercapacitor technologies [88].
This Ragone plot analysis demonstrates the distinctive positioning of various capacitor technologies across the energy-power spectrum. Electric double-layer capacitors (EDLCs) excel in high-power applications requiring rapid charge-discharge cycles and exceptional longevity, while pseudocapacitors offer enhanced energy density through Faradaic charge storage mechanisms. Hybrid capacitors strategically combine these approaches to achieve more balanced performance characteristics, bridging the gap between conventional supercapacitors and batteries.
For researchers and development professionals, understanding these relationships enables informed technology selection based on application-specific requirements. The continuing evolution of advanced materials—particularly pseudocapacitive compounds and hybrid configurations—promises further enhancements in capacitor performance, potentially expanding their role in emerging applications from renewable energy integration to electric mobility. The Ragone plot remains an indispensable tool for visualizing these technological relationships and guiding the development of next-generation energy storage systems.
In the evolving landscape of energy storage, capacitors have emerged as critical components complementing and sometimes replacing traditional batteries, particularly in applications demanding high power and long cycle life. This guide provides an objective comparison of the performance of different capacitor types, framed within broader research on energy density. For researchers and scientists, especially those in fields requiring precise power management and rapid energy delivery, understanding the trade-offs between various energy storage technologies is fundamental. Capacitors, with their diverse classifications—from traditional dielectric capacitors to advanced supercapacitors and hybrid systems—offer a spectrum of performance characteristics tailored to specific application needs, from electric vehicles to grid storage and portable electronics [40].
The following sections present a detailed, data-driven comparison of key performance metrics, including energy density, power density, efficiency, and cycle life, supported by experimental data and standardized testing methodologies.
Performance Metrics Comparison
The performance of energy storage devices is primarily evaluated through several key metrics. Energy density (Wh/kg or Wh/L) measures the amount of energy a device can store per unit mass or volume. Power density (W/kg or W/L) indicates the rate at which energy can be delivered or absorbed. Cycle life is the number of complete charge-discharge cycles a device can endure before its capacity falls below a specified percentage of its initial value (often 80%). Efficiency refers to the ratio of energy output to energy input during a cycle, typically expressed as a percentage, with losses often arising from internal equivalent series resistance (ESR) [97] [40].
The table below summarizes the quantitative performance ranges for major capacitor and battery technologies, providing a baseline for comparison.
Table 1: Comparative Performance Metrics of Energy Storage Technologies
| Technology | Energy Density (Wh/kg) | Power Density (W/kg) | Cycle Life (Cycles) | Efficiency (%) |
|---|---|---|---|---|
| Dielectric Capacitors [40] | 0.05 - 2 | 10,000 - 100,000 | > 100,000 | > 95 |
| Double-Layer Capacitors (EDLC) [40] [98] | 1 - 10 | 1,000 - 10,000 | 100,000 - 1,000,000 | 85 - 98 |
| Lithium-Ion Capacitors (LiC) [59] [99] | 10 - 60 | 1,000 - 10,000 | 10,000 - 100,000 | 90 - 95 |
| Lithium Iron Phosphate (LFP) Battery [59] | 80 - 160 | 150 - 500 | 2,000 - 5,000 | 95 - 99 |
The data reveals a clear performance trade-off: technologies with high energy density, like LFP batteries, typically have lower power density and cycle life. Conversely, capacitors excel in power density and cycle life but store less energy. Lithium-ion capacitors represent a hybrid middle ground, balancing moderate energy density with high power and long life [59] [99].
Table 2: Additional Characteristics and Common Applications
| Technology | Key Characteristics | Typical Applications |
|---|---|---|
| Dielectric Capacitors | Very fast discharge, high voltage tolerance, low energy storage | Pulse power systems, power conditioning, filters [40] |
| Double-Layer Capacitors (EDLC) | Rapid charge/discharge, wide temperature range, high reliability | Regenerative braking in EVs, backup power, peak power support [61] [97] |
| Lithium-Ion Capacitors (LiC) | Higher energy than EDLC, combines battery and capacitor electrodes | Grid energy storage, renewable energy integration, portable electronics [59] [99] |
| Lithium Iron Phosphate (LFP) Battery | High energy density, stable chemistry, lower power density | Electric vehicles, consumer electronics, large-scale energy storage [59] |
Experimental Protocols for Performance Evaluation
Standardized experimental protocols are essential for generating comparable and reliable performance data. The following methodologies are commonly employed in research and industry to characterize energy storage devices.
Galvanostatic Charge-Discharge (GCD) Testing
Objective: To measure capacitance, energy density, power density, and cycle life under a constant current.
Protocol:
- Conditioning: The capacitor is subjected to 10 cycles of low-current charging and discharging to stabilize the electrochemical interface.
- Charge Phase: The device is charged to its maximum rated voltage at a constant current in a temperature-controlled environment (e.g., 25°C).
- Hold Phase: Once the maximum voltage is reached, it is maintained for a set duration (e.g., 10-30 minutes) to ensure full saturation.
- Discharge Phase: The device is discharged to its minimum cutoff voltage at the same constant current.
- Data Collection: Voltage vs. time is recorded throughout the cycle. The discharge curve's slope is used to calculate capacitance (C = I × Δt / ΔV), which is then used to derive energy density (E = ½ C V²) and power density (P = E / Δt).
- Cycle Life Testing: Steps 2-5 are repeated for thousands of cycles. Capacity retention is tracked, and the cycle life is determined when the device's capacitance drops to 80% of its initial value [59] [40].
Electrochemical Impedance Spectroscopy (EIS)
Objective: To analyze internal resistance, capacitance, and charge transfer mechanisms by measuring the device's impedance across a frequency range.
Protocol:
- Setup: The device is stabilized at a specific state-of-charge (e.g., 50%) and open-circuit voltage.
- Frequency Sweep: A small alternating voltage (e.g., 10 mV amplitude) is applied across a wide frequency range (e.g., 0.01 Hz to 100 kHz).
- Measurement: The resulting current and phase shift are measured to determine impedance.
- Analysis: Data is plotted on a Nyquist plot. The high-frequency intercept with the real axis gives the Equivalent Series Resistance (ESR). The slope of the low-frequency line relates to the capacitive behavior. This data is critical for determining peak power capability and efficiency losses [40].
The workflow for a comprehensive capacitor evaluation, from preparation to data analysis, is outlined in the following diagram:
Diagram 1: Capacitor evaluation workflow.
The Scientist's Toolkit: Essential Research Reagents and Materials
The experimental study and development of advanced capacitors rely on a range of specialized materials and reagents. The following table details key components used in the fabrication and testing of hybrid and supercapacitors.
Table 3: Key Research Reagent Solutions for Capacitor Development
| Material/Reagent | Function | Application Example |
|---|---|---|
| Conductive Polymers (e.g., PEDOT:PSS) [99] [98] | Active material for pseudocapacitance; provides high conductivity and fast redox reactions. | Electrode material in conductive polymer-based hybrid capacitors. |
| Activated Carbon [40] [98] | High-surface-area electrode material for electric double-layer charge storage. | Primary electrode material in Double-Layer Capacitors (EDLCs). |
| Lithium Titanate (LTO) [59] | Battery-type anode material; enables high-rate capability and long cycle life. | Anode in Lithium-Ion Capacitors (LiCs) paired with a capacitive cathode. |
| Organic Electrolytes (e.g., LiPF₆ in EC/DMC) [59] | Ion-conducting medium; determines the operating voltage window and temperature range. | Used in high-energy density Lithium-Ion Capacitors. |
| Aqueous Electrolytes (e.g., KOH, H₂SO₄) [40] | Ion-conducting medium; offers high conductivity and enhanced safety. | Common in laboratory research for supercapacitors. |
| NPO/COG Ceramic Formulation [100] | Class 1 dielectric material; provides exceptional thermal stability and minimal capacitance drift. | Used in Multilayer Ceramic Capacitors (MLCCs) for high-reliability automotive applications. |
This comparison guide elucidates the distinct performance landscapes of capacitor technologies against a traditional LFP battery baseline. Dielectric capacitors offer unparalleled power density and cycle life but are limited by low energy storage. Double-layer capacitors significantly improve energy density while maintaining high power and exceptional cycle life. Lithium-ion capacitors bridge the gap further, offering a balanced compromise suitable for applications requiring both decent energy storage and rapid charge-discharge capabilities.
The choice of technology is inherently application-dependent, dictated by specific requirements for energy, power, longevity, and cost. Future research, focused on novel materials like advanced ceramics and hybrid systems, continues to push the boundaries of these metrics, particularly energy density, promising even more capable energy storage solutions to support technological advancement across various industries.
In the field of modern energy storage, dielectric capacitors and supercapacitors represent two distinct classes of technology with unique operational principles and performance characteristics. The evaluation of their energy density—a key figure of merit—is fundamental to understanding their application-specific advantages and limitations. Dielectric capacitors, which store energy electrostatically in a dielectric material, deliver exceptional power density and rapid discharge capabilities [40]. In contrast, supercapacitors (also known as ultracapacitors) leverage electrochemical double-layer capacitance and pseudocapacitance to achieve significantly higher energy storage capacity, bridging the gap between traditional capacitors and batteries [101] [2]. This comparative analysis examines the fundamental properties, experimental performance data, and material considerations for both technologies within the context of advanced energy storage research, providing researchers with a framework for selecting appropriate solutions based on specific application requirements in fields ranging from pulsed power systems to renewable energy integration.
Fundamental Principles and Energy Storage Mechanisms
Dielectric Capacitors: Electrostatic Energy Storage
Dielectric capacitors operate on the principle of electrostatic energy storage, where energy is stored in the electric field formed between two conductive electrodes separated by an insulating dielectric material [102] [40]. When a voltage is applied across the electrodes, opposite charges accumulate on their surfaces, creating an electric field that stores energy. The capacitance value is determined by the surface area of the electrodes (A), the distance between them (d), and the dielectric constant (εr) of the insulating material, as expressed by the equation: C = ε₀εrA/d, where ε₀ represents the vacuum permittivity [40].
The energy storage mechanism relies entirely on physical charge separation without chemical reactions, enabling extremely fast charging and discharging cycles—often in microseconds to milliseconds [40]. This purely physical operation contributes to exceptional cycle life, typically exceeding millions of charge-discharge cycles with minimal performance degradation [102]. Common dielectric materials include polymers (e.g., polypropylene, polyimide), ceramics (e.g., barium titanate), and metal oxides, each offering distinct trade-offs between dielectric strength, temperature stability, and capacitance density [40] [103].
Supercapacitors: Electrochemical Energy Storage
Supercapacitors employ more complex energy storage mechanisms that combine electrostatic and electrochemical principles [101] [2]. Unlike dielectric capacitors, supercapacitors utilize two high-surface-area electrodes immersed in an electrolyte solution, separated by an ion-permeable membrane [2]. Two primary mechanisms contribute to their energy storage:
Electrical Double-Layer Capacitance (EDLC): When voltage is applied, solvated ions in the electrolyte form opposite charged layers at the electrode-electrolyte interfaces, separated by a molecular monolayer of solvent molecules [2]. This creates an extremely effective charge separation at the angstrom level (0.3-0.8 nm), resulting in significantly higher capacitance compared to conventional dielectric capacitors [2]. Carbon-based materials with high specific surface areas, such as activated carbon, graphene, and carbon nanotubes, are typically used in EDLC applications [79].
Pseudocapacitance: Certain electrode materials, including metal oxides (e.g., ruthenium oxide) and conducting polymers, enable fast, reversible faradaic redox reactions at the electrode-electrolyte interface [2]. These electrochemical reactions involve electron transfer that contributes additional capacitance beyond the electrostatic double-layer effect [2]. Pseudocapacitance can provide higher energy density than pure EDLC mechanisms but may compromise some power density and cycle life due to the involvement of chemical reactions [2].
Many advanced supercapacitors function as hybrid systems, incorporating both double-layer and pseudocapacitive mechanisms to optimize overall performance [102] [2].
Figure 1: Fundamental energy storage mechanisms of dielectric capacitors and supercapacitors. Dielectric capacitors rely solely on electrostatic field storage in solid dielectrics, while supercapacitors combine electric double-layer formation and electrochemical redox reactions.
Performance Characteristics and Quantitative Comparison
Comparative Performance Metrics Table
The application-specific advantages and limitations of dielectric capacitors and supercapacitors become evident when comparing their key performance metrics. The table below summarizes quantitative data gathered from recent experimental studies and commercial specifications.
Table 1: Performance comparison between dielectric capacitors and supercapacitors
| Performance Parameter | Dielectric Capacitors | Supercapacitors | Measurement Context |
|---|---|---|---|
| Energy Density | 0.05-5 J/cm³ [40] [104] | 5-50 J/cm³ [40] | Commercial range values |
| Power Density | 10⁷-10⁹ W/kg [31] | 10⁴-10⁶ W/kg [40] | Normalized to mass |
| Cycle Life | >10⁶ cycles [102] | 10⁴-10⁶ cycles [102] [105] | To 80% initial capacity |
| Charge/Discharge Time | Microseconds-milliseconds [40] | Seconds-minutes [101] | Typical operational range |
| Efficiency | >95% [40] | 85-98% [105] | Round-trip energy efficiency |
| Operating Voltage | Up to kV range per unit [40] | 1.2-3.5V per cell [2] | Typical maximum values |
| Temperature Range | -50 to 200+°C [31] [104] | -40 to 85°C (extended to 105°C) [79] | Commercial specification |
Performance Trade-Offs and Application Alignment
The performance data reveals fundamental trade-offs that dictate appropriate application domains for each technology. Dielectric capacitors excel in applications requiring extreme power density, rapid energy delivery, and high voltage operation. Their ability to discharge stored energy in microseconds makes them indispensable in pulsed power systems, medical defibrillators, electromagnetic launchers, and power conditioning equipment [40] [104]. Recent advances in high-temperature dielectric materials have expanded their operational range to 200°C and beyond, enabling use in demanding environments such as electric vehicle power electronics, aerospace systems, and down-hole oil and gas exploration without requiring extensive cooling systems [31] [104].
Supercapacitors occupy a complementary niche where higher energy density is required while maintaining power density substantially superior to batteries. Their intermediate position in the energy-power spectrum makes them ideal for applications requiring frequent charge-discharge cycling with moderate energy requirements, such as regenerative braking systems in vehicles, grid stabilization for renewable energy integration, backup power systems, and consumer electronics [102] [79] [101]. The ability to undergo hundreds of thousands of charge-discharge cycles with minimal degradation provides a maintenance advantage in applications where battery replacement would be problematic [102].
Experimental Data and Research Methodologies
High-Temperature Dielectric Capacitor Experimental Protocol
Recent research has focused on enhancing the energy density and temperature stability of dielectric capacitors through advanced material engineering. The following experimental methodology from a 2024 study demonstrates approaches to achieving high performance under extreme conditions [31]:
Objective: Discover polymer dielectrics with high thermal stability and energy density over a broad temperature range (85-200°C) using AI-assisted materials screening [31].
Materials and Synthesis:
- AI Screening Platform: Employed polyVERSE computational framework generating polymer structures from commercially available monomers using established chemical reactions [31].
- Polymer Families: Focused on polynorbornene and polyimide derivatives based on predicted properties [31].
- Film Fabrication: Solution-cast polymer films with thicknesses of 5-20 μm, followed by thermal curing under inert atmosphere [31].
- Electrode Deposition: Sputtered gold or aluminum electrodes (100-200 nm thickness) with controlled patterning for electrical characterization [31].
Characterization Methods:
- Dielectric Spectroscopy: Measured dielectric constant (ε) and loss tangent (tan δ) across frequency (0.1 Hz-1 MHz) and temperature (25-250°C) ranges [31].
- Breakdown Field Testing: Determined dielectric breakdown strength (Ebd) using linearly increasing voltage ramp (100 V/s) until failure; reported as Weibull statistical distribution [31].
- Energy Density Calculation: Derived from measured ε and Ebd using the equation: Ue = ½ε₀εEbd², where ε₀ is vacuum permittivity [31].
- Thermal Analysis: Utilized differential scanning calorimetry (DSC) to determine glass transition temperature (Tg) and thermogravimetric analysis (TGA) for decomposition temperature [31].
Key Results: The study identified a previously unknown polynorbornene dielectric (PONB-2Me5Cl) exhibiting an energy density of 8.3 J/cm³ at 200°C—approximately 11 times higher than commercially available polymer dielectrics at this temperature [31].
Advanced Supercapacitor Experimental Protocol
A 2025 study on solid-state supercapacitors illustrates methodologies for enhancing supercapacitor performance through novel electrolyte compositions:
Objective: Develop high-energy-density solid-state supercapacitors using ionic liquid-dispersed Li⁺ ion-perovskite composite electrolytes [105].
Materials and Synthesis:
- Electrolyte Preparation: Synthesized Li₀.₃₄La₀.₅₁TiO₃ (LLTO) perovskite via sol-gel route, calcined at 900°C for 6 hours [105].
- Composite Formation: Mechanically mixed LLTO powder with 1-8 wt% ionic liquids (EMIM BF₄ or EMIM CF₃SO₃) using planetary ball milling [105].
- Electrode Fabrication: Prepared activated carbon electrodes with 90:10 weight ratio of activated carbon to PVDF binder, coated onto copper current collectors [105].
- Device Assembly: Fabricated laminated cell structure by compressing electrolyte between electrodes under controlled pressure [105].
Electrochemical Characterization:
- Ionic Conductivity: Measured via electrochemical impedance spectroscopy (EIS) from 1 Hz to 1 MHz, showing optimal composition achieved ~10⁻³ Ω⁻¹ cm⁻¹ at room temperature [105].
- Cyclic Performance: Evaluated using galvanostatic charge-discharge (GCD) cycling at 2V operating voltage and 1.13 A/g discharge current for 10,000 cycles [105].
- Specific Capacitance: Calculated from discharge curves using standard formulae, reaching approximately 510 F/g at 0.57 A/g and 2V [105].
- Coulombic Efficiency: Determined from charge-discharge profiles, achieving ~99% efficiency over extended cycling [105].
Key Results: The optimized composite electrolyte demonstrated three orders of magnitude higher ionic conductivity than pristine LLTO, enabling solid-state supercapacitors with exceptional cycling stability and high specific capacitance [105].
Figure 2: Experimental workflows for characterizing dielectric capacitors and supercapacitors. Dielectric capacitor testing focuses on material properties and breakdown characteristics, while supercapacitor evaluation emphasizes electrochemical performance and cycling stability.
Research Reagent Solutions and Essential Materials
Key Materials for Energy Storage Research
Table 2: Essential research materials for capacitor development
| Material Category | Specific Examples | Function in Research | Performance Relevance |
|---|---|---|---|
| Dielectric Polymers | Polynorbornenes [31], Polyimides [31], Biaxially oriented polypropylene (BOPP) [31] | Insulating medium for electrostatic energy storage | Determines breakdown strength, temperature stability, dielectric constant |
| High-Entropy Ceramics | Bi₀.₅Na₀.₅TiO₃-based systems [104], LLTO perovskite [105] | High-temperature dielectric or solid electrolyte | Enables operation at >200°C, enhances energy density |
| Carbon Electrodes | Activated carbon [79] [105], Graphene, Carbon nanotubes [79] | High-surface-area electrodes for supercapacitors | Provides electric double-layer capacitance, cycle stability |
| Ionic Liquids | EMIM BF₄ [105], BMIM BF₄ [105] | Electrolyte component for supercapacitors | Enhances ionic conductivity, operating voltage window |
| Metal Oxide Electrodes | Ruthenium oxide [2], Manganese oxide [79] | Pseudocapacitive electrodes | Adds faradaic charge storage, increases energy density |
| Conductive Additives | Carbon black, Silver nanoparticles | Electrode composition enhancers | Improves electrical conductivity, rate capability |
| Binder Materials | PVDF [105], PTFE | Electrode structural integrity | Maintains mechanical stability during cycling |
Application-Specific Advantages and Limitations
Dielectric Capacitor Application Domains
Dielectric capacitors provide critical functionality in applications where rapid energy discharge, high power density, and voltage handling capability are paramount:
Pulsed Power Systems: The extremely high power density (up to 10⁹ W/kg) and microsecond discharge capabilities make dielectric capacitors indispensable in medical defibrillators, pulsed lasers, electromagnetic armor, and radar systems [40] [104]. Their ability to deliver very high current pulses for short durations is unmatched by other energy storage technologies.
Power Electronics: In power conditioning, DC-link applications, and frequency conversion systems, dielectric capacitors provide vital functions including ripple current filtering, snubber circuits, and energy buffer capabilities [40] [103]. Recent advances in high-temperature dielectrics enable operation in demanding environments like electric vehicle inverters and industrial motor drives without complex cooling systems [31] [104].
High-Temperature Environments: Specialty dielectric capacitors based on high-entropy ceramics or advanced polymers can operate reliably at temperatures exceeding 200°C, making them suitable for aerospace, geothermal, and automotive applications where cooling systems would be impractical [104]. A 2025 study demonstrated stable operation up to 320°C using entropy-stabilized Bi₀.₅Na₀.₅TiO₃-based thin films [104].
The primary limitation of dielectric capacitors remains their relatively low energy density compared to electrochemical storage technologies. While recent material innovations have significantly improved performance, their energy storage capacity per unit volume remains substantially lower than batteries and supercapacitors, necessitating larger systems for applications requiring sustained energy delivery [40].
Supercapacitor Application Domains
Supercapacitors deliver superior performance in applications requiring high cycle life, rapid charge/discharge capability, and intermediate power and energy density:
Recuperative Energy Systems: The ability to efficiently capture and release energy during short-duration cycles makes supercapacitors ideal for regenerative braking in vehicles, cranes, and elevators [79] [2]. Their high efficiency (85-98%) and cycle life (>100,000 cycles) provide maintenance-free operation in demanding cycling applications [105].
Renewable Energy Integration: Supercapacitors effectively smooth intermittent power generation from solar and wind sources, providing short-term energy storage for frequency regulation and power quality management [79]. Their rapid response time (seconds) complements slower battery systems in hybrid energy storage configurations [79].
Backup Power Systems: For memory backup, emergency lighting, and critical system shutdown protocols, supercapacitors offer maintenance-free operation with predictable performance over decades of service [2]. Unlike batteries, they do not require replacement at regular intervals and perform reliably across wide temperature ranges [79].
The limitations of supercapacitors include higher cost per energy unit compared to batteries, lower energy density than electrochemical batteries, and voltage limitations that require series connections for higher voltage applications, necessitating sophisticated balancing circuits [101] [2]. Additionally, their self-discharge rates are typically higher than those of dielectric capacitors, making them less suitable for long-term energy storage applications [2].
Dielectric capacitors and supercapacitors represent complementary rather than competing technologies, each exhibiting distinct advantages within their respective application domains. Dielectric capacitors remain unchallenged for applications demanding extreme power density, high-voltage operation, and microsecond response times, with recent material advances significantly expanding their temperature operating range and energy density. Supercapacitors fill the critical gap between traditional capacitors and batteries, offering superior cycle life and power density compared to batteries, while providing significantly higher energy density than dielectric capacitors. The ongoing research in high-entropy dielectrics, AI-accelerated material discovery, solid-state electrolytes, and hybrid energy storage mechanisms continues to push the performance boundaries of both technologies. For researchers and engineers, selection between these technologies requires careful consideration of application-specific requirements including energy density, power density, cycle life, temperature range, and response time characteristics. The experimental methodologies and performance data presented in this analysis provide a framework for making informed decisions based on current technological capabilities and emerging research directions.
Technology Readiness Levels (TRL) are a systematic metric used to assess the maturity level of a particular technology. The scale ranges from TRL 1, the most basic stage of research, to TRL 9, where a technology has been proven successful in its operational environment. This framework was originally developed by NASA in the 1970s to provide a consistent understanding of technological maturity during the acquisition phase of space programs [106]. It has since been adopted widely across industries, including the Department of Defense, the European Union, and in the development of energy technologies [106] [107].
For researchers and scientists evaluating energy storage technologies like capacitors, the TRL framework provides a common language to communicate progress, manage risks, and make informed decisions about technology funding and transition from research to commercialization [106]. This is particularly crucial in the field of energy storage, where the transition from laboratory research to commercially viable products is complex and resource-intensive.
The TRL Scale: From Principle to Proven Operation
The standard TRL scale consists of nine distinct levels, each defined by specific criteria and milestones [108]. Table 1 summarizes these levels, integrating definitions from both NASA and the European Union.
Table 1: Technology Readiness Level (TRL) Definitions
| TRL | Description | Key Activities and Milestones |
|---|---|---|
| TRL 1 | Basic principles observed and reported [106]. | Initial scientific research begins; results are translated into future R&D [108]. |
| TRL 2 | Technology concept and/or application formulated [106]. | Practical applications are identified, but the technology remains speculative with no experimental proof of concept [108]. |
| TRL 3 | Analytical and experimental critical function and/or characteristic proof-of-concept [106]. | Active R&D initiates, including analytical and laboratory studies; a proof-of-concept model is often constructed [108]. |
| TRL 4 | Component and/or breadboard validation in a laboratory environment [106]. | Multiple component pieces are tested together in a laboratory setting [108]. |
| TRL 5 | Component and/or breadboard validation in a relevant environment [106]. | A breadboard technology undergoes rigorous testing in environments that closely simulate real-world conditions [108]. |
| TRL 6 | System/subsystem model or prototype demonstration in a relevant environment [106]. | A fully functional prototype or representational model is tested in a relevant environment [108]. |
| TRL 7 | System prototype demonstration in an operational environment [106]. | A working model or prototype is demonstrated in its intended operational environment (e.g., a space environment for NASA) [108]. |
| TRL 8 | Actual system completed and "flight qualified" through test and demonstration [106]. | The technology is tested and deemed ready for implementation into an existing system [108]. |
| TRL 9 | Actual system proven through successful mission operations [106]. | The technology is proven successful and operational in its real mission [108]. |
The progression of a technology from idea to commercial reality follows a structured pathway. The following workflow visualizes this innovation journey, showing the key milestones and activities that define each stage of technological maturity.
Capacitor Technologies for Energy Storage: A Comparative Analysis
Capacitors are passive electrical components that store energy in an electric field, characterized by two conductive plates separated by a dielectric material [109]. They are critical in power electronics for functions including energy storage, filtering, and decoupling [110]. A key metric for evaluating their performance in energy storage applications is energy density, which refers to the amount of energy a capacitor can store per unit volume or mass.
Different capacitor technologies offer a trade-off between energy density, power density, and other performance characteristics. Table 2 provides a comparative overview of major capacitor types relevant to energy storage research.
Table 2: Performance Comparison of Capacitor Technologies for Energy Storage
| Capacitor Type | Typical Energy Density | Key Advantages | Key Limitations | Common Applications in Power Electronics |
|---|---|---|---|---|
| Aluminum Electrolytic | Up to ~1 J/cm³ (Volumetric) [110] | High capacitance per unit volume, cost-effective [110]. | Higher Equivalent Series Resistance (ESR), limited lifetime due to electrolyte drying, inferior frequency characteristics [111]. | DC-link capacitors, smoothing, and buffering in power supplies [112] [110]. |
| Supercapacitors (EDLC) | Information Missing | Very high power density, fast charge/discharge, long cycle life [113]. | Lower energy density compared to batteries [113]. | Regenerative braking, backup power systems, quick burst power delivery [112]. |
| Film (e.g., Polypropylene) | Information Missing | Low ESR/ESL, long lifespan, high reliability, self-healing capability [109] [110]. | Lower volumetric efficiency, large physical size for high capacitance [110]. | Snubber circuits, EMI filters, DC-link applications requiring high ripple current [110]. |
| Multilayer Ceramic (MLCC) | Information Missing | Small form factor, high stability, low ESL [112] [109]. | Capacitance highly dependent on temperature and DC bias; piezoelectric effect can cause acoustic noise [111] [109]. | Decoupling, high-frequency filtering [112]. |
| Polymer Aluminum Electrolytic | Information Missing | Lower ESR than standard electrolytic, longer life, stable temperature characteristics [111]. | Higher cost, lower capacitance density than standard electrolytic [111]. | Ripple absorption in switching power supplies, applications requiring low ESR and long life [111]. |
The relationship between different energy storage technologies can be visualized based on their power and energy delivery capabilities. The following diagram situates supercapacitors relative to traditional capacitors and batteries, illustrating their unique role in bridging the performance gap between these technologies.
Experimental Protocols for Assessing Capacitor Energy Density
To ensure reproducible and comparable results in capacitor research, standardized experimental protocols are essential. The following methodology outlines key procedures for evaluating the charge storage characteristics and energy density of capacitor materials, drawing from recent research on advanced lithium-ion hybrid capacitors (LIHCs) [76].
Material Synthesis and Electrode Preparation
Protocol: Synthesis of 3D Graphene Nanoflakes (GNFs) via Plasma-Enhanced CVD (PECVD) [76]
- Substrate Preparation: Clean copper foils (e.g., 26 μm thick, 99.996% purity) sequentially in an ultrasonic bath with acetone, methanol, and isopropanol for 10 minutes each. Gently dry the foils using a stream of inert gas like nitrogen.
- Reactor Setup: Place the cleaned copper foil on a quartz holder and transfer it into a quartz reaction tube. Flush the tube with argon gas to create an inert atmosphere.
- Growth Process: Introduce a precursor gas mixture of methane (CH₄), argon (Ar), and hydrogen (H₂) at a precise ratio (e.g., 10:2:5 SCCM) into the chamber.
- Plasma Activation: Initiate a microwave plasma (e.g., 2.45 GHz, 60 W power) in close proximity to the copper substrate. The chamber pressure should be maintained at approximately 0.5 Torr. The growth is typically completed in a short duration (e.g., 10 minutes) at a low temperature (<300 °C).
- Product Collection: After synthesis, return the chamber to atmospheric pressure with an inert gas. The resulting 3D GNF powder is collected by gently scraping it from the copper foil surface.
Protocol: Electrode Fabrication for Lithium-Ion Hybrid Capacitors (LIHCs) [76]
- Slurry Formulation: Create a homogeneous slurry by mixing the active material (e.g., Activated Carbon - ACS20), a conductive additive (e.g., the synthesized GNFs or commercial Super P), and a binder in a suitable solvent.
- Coating and Drying: Coat the slurry onto a current collector (e.g., aluminum foil) and dry it thoroughly to evaporate the solvent.
- Electrode Assembly: The LIHC is typically constructed using an activated carbon-based anode and a cathode composed of a mixture of activated carbon and lithium iron phosphate (LiFePO₄ or LFP) in a specific weight ratio (e.g., 6.6:1) [76].
Electrochemical Characterization and Performance Metrics
Protocol: Coin Cell Assembly and Testing [76]
- Cell Assembly: Assemble the tested electrodes into coin cells (e.g., CR2032) in an argon-filled glove box to prevent moisture and oxygen contamination. Use a lithium metal counter/reference electrode, a suitable separator, and an electrolyte.
- Galvanostatic Charge-Discharge (GCD): Perform charge-discharge cycling on the assembled cells at various constant current densities (e.g., from 0.05 A g⁻¹ upwards) between set voltage limits.
- Data Calculation:
- Capacity: Calculate the specific capacity (in mAh g⁻¹) from the discharge curve.
- Energy Density: Calculate the specific energy density (in Wh kg⁻¹) using the formula: Energy Density = (Capacity × Average Discharge Voltage) / Mass of active material.
- Cycle Life Testing: Subject the cell to repeated charge-discharge cycles (e.g., 600 cycles) to measure capacity retention over time [76].
Protocol: Material Characterization
- Structural Analysis: Use Focused Ion Beam Scanning Electron Microscopy (FIB-SEM) and Transmission Electron Microscopy (TEM) to analyze the morphology, structure, and porosity of the synthesized materials [76].
- Spectroscopic Analysis:
The Scientist's Toolkit: Essential Research Reagents and Materials
Successful experimentation in advanced capacitor development relies on a suite of specialized materials and equipment. Table 3 catalogs key research reagents and their functions, based on the cited experimental protocols.
Table 3: Essential Research Reagents and Materials for Capacitor Development
| Item Name | Function/Application | Example Specifications |
|---|---|---|
| Activated Carbon (AC) | High-surface-area electrode material for electric double-layer charge storage [76]. | ACS20; used as primary anode material and in composite cathodes [76]. |
| Lithium Iron Phosphate (LFP) | Cathode active material for lithium-ion battery-type electrodes; provides high theoretical specific capacity via ion intercalation [76]. | LiFePO₄; mixed with activated carbon in a hybrid capacitor cathode [76]. |
| Conductive Additives | Enhance electrical conductivity within the electrode composite; form conductive networks [76]. | 3D Graphene Nanoflakes (GNFs), Carbon Black (e.g., Super P) [76]. |
| Copper Foil Substrate | Serves as a catalytic substrate and physical support for the growth of carbon nanomaterials via CVD [76]. | 26 μm thick, 99.996% purity; cleaned prior to use [76]. |
| Precursor Gases | Source of carbon and process gases for the synthesis of carbon nanomaterials like graphene [76]. | CH₄ (carbon source), Ar (carrier gas), H₂ (process gas); used in PECVD [76]. |
| Polymer Binder | Binds active electrode particles and conductive additives together and to the current collector. | Polyvinylidene fluoride (PVDF) or carboxymethyl cellulose (CMC) are common examples. |
| Lithium Metal Foil | Serves as the counter/reference electrode in half-cell configurations for electrochemical testing. | High purity (e.g., 99.9%), used in coin cell assembly [76]. |
| Organic Electrolyte | Conducts ions between the electrodes during charge and discharge cycles. | e.g., 1 M LiPF₆ in a mixture of ethylene carbonate and dimethyl carbonate [76]. |
| Celgard Separator | Porous membrane that prevents physical contact (short circuit) between electrodes while allowing ion transport. | Polypropylene or polyethylene membrane [76]. |
Lithium-Ion Capacitors (LICs) represent a revolutionary class of hybrid energy storage devices that bridge the performance gap between traditional lithium-ion batteries and supercapacitors. By integrating a battery-type electrode with a capacitor-type electrode within a single system, LICs successfully combine the high energy density characteristic of batteries with the high power density and long cycle life of supercapacitors. This unique configuration addresses the fundamental limitations of conventional energy storage technologies, offering a balanced solution for applications requiring both substantial energy storage and rapid charge-discharge capabilities.
The global market for these advanced energy storage systems is experiencing robust growth, driven by increasing demand across sectors such as electric vehicles, renewable energy integration, and portable electronics. The lithium-ion hybrid capacitor market is projected to reach $2.5 billion by 2025, with a compound annual growth rate (CAGR) of 15% forecasted through 2033 [114]. Similarly, the broader hybrid supercapacitor market, valued at $1.13 billion in 2024, is expected to reach $2.41 billion by 2032, growing at a CAGR of 9.94% [115]. This significant expansion underscores the increasing technological and commercial importance of LICs in the evolving energy storage landscape.
Performance Benchmarking: LICs vs. Alternative Technologies
Comparative Performance Metrics
Table 1: Performance comparison of energy storage technologies
| Technology | Energy Density (Wh/kg) | Power Density (W/kg) | Cycle Life (cycles) | Key Characteristics |
|---|---|---|---|---|
| Lithium-Ion Capacitors (LICs) | 84-229 | 396-25,000 | 10,000+ (68-81% retention) | Hybrid charge storage mechanism |
| Graphene-Enhanced LIC | 115.58 | 396 | 600 (86.4% retention) | 3D graphene nanoflake additive [116] |
| Si/C Composite LIC | 222.29 | 25,000 | 10,000 (81.3% retention) | Carbon-encapsulated silicon anode [117] |
| Sb@Si/C LIC | 163.42 | N/A | 10,000 (69% retention) | Antimony-silicon composite anode [118] |
| Sn-C//PAC LIC | 195.7 | 24,375 | N/A | Tin-carbon anode with biomass-derived carbon [119] |
| Traditional Supercapacitors | 5-10 | >10,000 | >100,000 | Electric double-layer storage only [119] |
| Lithium-Ion Batteries | 130-200 | <1,000 | 1,000-2,000 | Intercalation mechanism [119] |
Table 2: Market characteristics and application focus
| Parameter | Lithium-Ion Capacitors | Lithium-Ion Batteries | Supercapacitors |
|---|---|---|---|
| Primary Market Segment | Automotive (36.4% share) [115] | Consumer electronics, EVs | Memory backup, power buffer |
| Growth Catalyst | EV adoption, renewable energy storage | Energy density demands | Power delivery needs |
| Cost Structure | Higher initial cost, improving with scale [114] | Decreasing but raw material concerns | Moderate, technology mature |
| Safety Profile | Lower thermal runaway risk vs. batteries [115] | Thermal management critical | Generally very safe |
| Temperature Performance | Wider operating range with advanced electrolytes [120] | Performance degrades at extremes | Stable across wide range |
Technology-Specific Advantages and Limitations
Lithium-Ion Capacitors demonstrate a distinctive performance profile that positions them between traditional batteries and supercapacitors. The energy density of advanced LICs (84-229 Wh/kg) significantly surpasses that of conventional supercapacitors (5-10 Wh/kg) while approaching the performance of lithium-ion batteries (130-200 Wh/kg) [117] [119]. Simultaneously, LICs maintain power densities (396-25,000 W/kg) that substantially exceed typical battery values (<1,000 W/kg) [117]. This balanced performance enables applications requiring both substantial energy storage and rapid power delivery.
The cycle life characteristics further highlight the hybrid advantage of LICs. While not matching the extreme cycle life of pure supercapacitors (>100,000 cycles), advanced LIC configurations demonstrate excellent capacity retention (68-86% after 600-10,000 cycles), significantly outperforming conventional lithium-ion batteries [116] [118] [117]. This durability advantage is particularly valuable in applications involving frequent charge-discharge cycles, such as regenerative braking in electric vehicles or grid frequency regulation.
Advanced Material Innovations in LICs
Anode Material Developments
Significant research efforts have focused on developing advanced anode materials to address the kinetic imbalance between battery-type anodes and capacitor-type cathodes in LIC systems. Silicon-based anodes have emerged as particularly promising due to silicon's exceptionally high theoretical specific capacity (4,200 mAh/g) [117]. However, pure silicon anodes suffer from substantial volume expansion (~300%) during lithiation/delithiation cycles, leading to rapid performance degradation. Innovative approaches such as carbon-encapsulated silicon microspheres (Si/C) have demonstrated remarkable success in addressing these limitations, delivering initial discharge capacities of 3,450 mAh/g while maintaining structural integrity over extended cycling [117].
Alternative anode compositions have also shown substantial promise. Antimony-based composites (Sb@Si/C) leverage antimony's high theoretical capacity (660 mAh/g) while mitigating volume expansion through carbon incorporation [118]. These systems have demonstrated specific capacitances of 188.27 F/g and energy densities of 163.42 Wh/kg in full-device configurations [118]. Similarly, tin-carbon nanocomposites (Sn-C) exploit tin's high lithium storage capacity (~992 mAh/g for Li₄.₄Sn) when structured as well-confined nanoparticles within a nitrogen-rich mesoporous carbon framework [119]. This configuration delivered exceptional energy densities of 195.7 Wh/kg at power densities of 731.25 W/kg [119].
Cathode and Additive Enhancements
Cathode development has similarly advanced through material engineering. Biomass-derived activated carbons have gained prominence due to their high surface areas, controllable microstructures, and sustainable sourcing [119]. These materials provide the high power density and rapid charge-discharge capabilities essential for the capacitive electrode in LIC systems.
The integration of advanced conductive additives has emerged as a powerful strategy for enhancing electrode performance. Three-dimensional graphene nanoflakes (GNFs) synthesized via plasma-enhanced chemical vapor deposition (PECVD) have demonstrated remarkable effectiveness when incorporated as additives in activated carbon-based electrodes [116]. This approach enables synthesis at lower temperatures (<300°C) without toxic gases or additional catalysts, producing GNFs with uniform open 3D networks, high conductivity, structural stability, and intrinsic hydrophilicity [116]. LICs incorporating 2.5 wt% GNF additives achieved substantial performance improvements, with capacities of 62.35 mAh/g and energy densities of 115.58 Wh/kg, surpassing systems using conventional carbon additives [116].
Experimental Protocols and Methodologies
Material Synthesis and Electrode Fabrication
Table 3: Key research reagents and materials for LIC development
| Material/Reagent | Function/Application | Key Characteristics |
|---|---|---|
| Silicon Microspheres | High-capacity anode material | Theoretical capacity: 4,200 mAh/g [117] |
| Antimony (Sb) Powder | Anode composite component | Theoretical capacity: 660 mAh/g [118] |
| Graphene Nanoflakes (GNFs) | Conductive additive | 3D network, high conductivity, hydrophilic [116] |
| Biomass-Derived Activated Carbon | High-surface-area cathode | Sustainable source, tunable porosity [119] |
| Polyvinylidene Difluoride (PVDF) | Electrode binder | Chemical stability, electrochemical inertness [116] |
| Ketjenblack EC-600JD | Capacitive cathode material | High surface area carbon [118] |
| N-Methyl-2-pyrrolidone (NMP) | Solvent for electrode slurry | PVDF dissolution, electrode processing [116] |
The synthesis of advanced electrode materials follows precisely controlled protocols. For silicon-carbon composites, the magnesiothermic reduction method is employed, wherein SiO₂ particles synthesized via the Stöber method undergo reduction in an inert atmosphere at elevated temperatures [117]. The resulting silicon microspheres are subsequently encapsulated with carbon through additional processing steps, creating the final Si/C composite architecture that mitigates volume expansion while enhancing electrical conductivity.
Graphene nanoflake synthesis utilizes an innovative plasma-enhanced CVD technique that represents a significant advancement over conventional methods [116]. This process operates at relatively low temperatures (<300°C) with short reaction times (approximately 10 minutes), utilizing non-toxic gas precursors without additional catalysts [116]. The resulting GNFs exhibit high defect density, excellent conductivity, and favorable hydrophilicity, making them ideal conductive additives for enhanced electrode performance.
Electrode fabrication typically employs a slurry-based process, where active materials, conductive additives, and binders are homogenized in an appropriate solvent (commonly N-methyl-2-pyrrolidone) and coated onto current collectors [116]. Some advanced implementations utilize binder-free approaches, creating free-standing electrodes (buckypaper) that eliminate electrochemically inactive components and enhance overall device performance [117].
Device Assembly and Electrochemical Testing
LIC device assembly typically employs coin cell (CR2032) configurations assembled in controlled atmosphere environments (argon-filled glove boxes) to prevent moisture and oxygen contamination [118]. The full-cell configuration consists of a pre-lithiated anode paired with a capacitive cathode, separated by a porous membrane and impregnated with lithium-containing organic electrolyte.
Electrochemical characterization follows standardized protocols using cycling voltammetry, galvanostatic charge-discharge measurements, and electrochemical impedance spectroscopy [118]. Performance metrics including energy density, power density, and cycle life are derived from these tests. Specific testing parameters vary depending on device configuration, with voltage windows typically between 1.5-4.5V and current densities calibrated to the specific capacity of the electrode materials [118] [119].
Diagram 1: Experimental workflow for LIC development and testing
Current Challenges and Future Research Directions
Technical Limitations and Research Barriers
Despite significant advancements, LIC technology faces several persistent challenges that remain active research areas. The high manufacturing costs compared to conventional energy storage technologies present a substantial barrier to widespread adoption [114]. These costs primarily stem from specialized electrode materials, controlled synthesis environments, and precise assembly requirements. Additionally, the kinetic mismatch between the faradaic battery-type anode and the non-faradaic capacitor-type cathode continues to limit optimal performance, particularly at high charge-discharge rates [121].
Material stability issues represent another significant challenge. While carbon encapsulation strategies have substantially improved the cycling stability of high-capacity anode materials, long-term degradation mechanisms associated with volume changes during cycling continue to affect device lifespan [117]. Furthermore, the limited energy density of current LIC systems, while improved compared to traditional supercapacitors, still falls short of advanced lithium-ion batteries, restricting application in energy-intensive scenarios [115].
Emerging Research Frontiers
Future LIC development is progressing along several promising technological pathways. Solid-state electrolytes represent a major research focus, offering enhanced safety characteristics and potentially higher energy densities, though development remains at an early stage [114]. Advanced electrode architectures including two-dimensional materials and metal-organic frameworks are being explored to increase surface area and enhance ion accessibility [120].
The integration of artificial intelligence and machine learning approaches for material optimization and device management is emerging as a powerful strategy for accelerating development cycles [114]. Additionally, sustainable material sourcing through increased utilization of biomass-derived carbons and reduced reliance on critical materials addresses both environmental and supply chain concerns [119]. The ongoing convergence of these advanced material systems and engineering approaches promises to further narrow the performance gap between LICs and conventional energy storage technologies while leveraging the unique advantages of hybrid configurations.
Lithium-Ion Capacitors have established a distinct technological position in the energy storage landscape, offering a compelling combination of battery-like energy density and supercapacitor-like power density and cycle life. Continuous advancements in electrode materials, particularly silicon- and antimony-based composites with carbon confinement architectures, have driven substantial performance improvements, with energy densities now exceeding 220 Wh/kg in advanced configurations [117].
The ongoing material innovations in conductive additives, particularly three-dimensional graphene networks, and sustainable biomass-derived carbons are further enhancing the performance and viability of LIC technology [116] [119]. While challenges remain in cost reduction and energy density optimization, the current trajectory of development suggests LICs will play an increasingly important role in applications requiring both high energy and high power delivery, particularly in the automotive, renewable energy integration, and industrial sectors. As research addresses existing limitations through solid-state systems, advanced material architectures, and improved manufacturing processes, LICs are positioned to become increasingly competitive with established energy storage technologies across a broadening range of applications.
Conclusion
The evaluation of capacitor energy density reveals a diverse technological landscape where no single solution fits all applications. Dielectric capacitors excel in high-power pulse delivery, while supercapacitors bridge the gap with superior cycle life and moderate energy density. Success hinges on selecting standardized measurement protocols aligned with operational needs and understanding the inherent trade-offs between energy density, power density, and longevity. Future advancements will be driven by material innovations such as graphene and MXenes, the development of sophisticated hybrid systems, and the ongoing standardization of performance validation methods. These developments promise to unlock new possibilities in biomedical devices, portable electronics, and grid-scale energy storage, making accurate energy density evaluation more critical than ever for research and development professionals.
References
- 1. Metrics and methods for moving from research to ... [https://www.nature.com/articles/s41467-022-29257-w]
- 2. Supercapacitor - Wikipedia [https://en.wikipedia.org/wiki/Supercapacitor]
- 3. Ultracapacitors Explained: Applications, Comparisons ... [https://optimalgroup.com.au/news/ultracapacitors-explained-with-applications-comparisons-and-examples]
- 4. A comprehensive review on supercapacitors: Basics to ... [https://www.sciencedirect.com/science/article/abs/pii/S2352152X25012113]
- 5. CMK-5-Based High Energy Density Electrical Double ... [https://pmc.ncbi.nlm.nih.gov/articles/PMC6854820/]
- 6. Aqueous hybrid electrochemical capacitors with ultra-high ... [https://www.nature.com/articles/s41467-022-34082-2]
- 7. Ultracapacitor technology [https://www.skeletontech.com/ultracapacitor-technology]
- 8. Development of a high-energy electrical double-layer ... [https://www.sciencedirect.com/science/article/pii/S0378775323003919]
- 9. Advanced supercapacitor sets energy density record at 418 ... [https://www.rinnovabili.net/tech-innovations-and-startups/energy-tech-innovations-and-startups/advanced-supercapacitor-energy-density-record/]
- 10. Research on prediction of energy density and power ... [https://www.sciencedirect.com/science/article/abs/pii/S2214993725000776]
- 11. Energy storage in the 21st century: A comprehensive ... [https://www.sciencedirect.com/science/article/abs/pii/S2352152X23027214]
- 12. Hybrid energy storage: Features, applications, and ... [https://www.sciencedirect.com/science/article/abs/pii/S1364032123010547]
- 13. Perspective: hybrid systems combining electrostatic and ... [https://pubs.rsc.org/en/content/articlelanding/2013/ee/c3ee40898a]
- 14. What is a Hybrid Energy Storage System (HESS)? [https://www.ossila.com/pages/hybrid-energy-storage-system]
- 15. Understanding the trade-off mechanisms of energy storage ... [https://www.sciencedirect.com/science/article/pii/S2949821X25000067]
- 16. Review of Hybrid Energy Storage Systems for ... [https://www.mdpi.com/2032-6653/15/8/342]
- 17. Electrostatic Storage vs Electrochemical Batteries [https://emtel.group/electrostatic-storage-vs-electrochemical-batteries/]
- 18. Volumetric performance and energy-storage mechanism of ... [https://www.sciencedirect.com/science/article/abs/pii/S1385894725023770]
- 19. 我国学者在高温储能聚合物薄膜电容器领域取得进展 [https://www.nsfc.gov.cn/p1/3381/2825/96014.html]
- 20. 电容选型及公式大全 [https://www.eet-china.com/mp/a382143.html]
- 21. 《超级电容器技术及市场-2025版》 - 超越摩尔市场报告 [https://www.mems.me/mems/more_than_moore_202508/13558.html]
- 22. 双电层电容器- 维基百科,自由的百科全书 [https://zh.wikipedia.org/zh-hans/%E5%8F%8C%E7%94%B5%E5%B1%82%E7%94%B5%E5%AE%B9%E5%99%A8]
- 23. 超级电容器的理论知识 [https://shiyanjia.com/knowledge/articleinfo-2008.html]
- 24. [ACIE]安时级钠离子电容器软包实现100C超快充电性能 [https://pcoss.xmu.edu.cn/info/1013/33474.htm]
- 25. 超级电容器市场规模、增长和行业趋势| 2025 - 2030 [https://www.mordorintelligence.com/zh-CN/industry-reports/supercapacitors-market]
- 26. 2025年超级电容器行业技术特点:核心特性、运输分类与合规 ... [https://m.chinabgao.com/info/1290355.html]
- 27. Materials design and preparation for high energy density ... [https://www.sciencedirect.com/science/article/abs/pii/S0927796X22000523]
- 28. Current status and future perspectives of low-temperature ... [https://pubs.rsc.org/en/content/articlehtml/2025/sc/d5sc03933a]
- 29. Capacitor types [https://en.wikipedia.org/wiki/Capacitor_types]
- 30. Boosting energy storage density of lithium-ion hybrid ... [https://pubs.rsc.org/en/content/articlelanding/2025/ra/d5ra06831b]
- 31. AI-assisted discovery of high-temperature dielectrics for ... [https://www.nature.com/articles/s41467-024-50413-x]
- 32. Achieving superior high-temperature capacitance ... [https://www.sciencedirect.com/science/article/abs/pii/S2405829725002065]
- 33. Prospects for the Development of High Energy Density ... [https://www.mdpi.com/2076-3417/11/17/8063]
- 34. A promising solution for sustainable energy storage and ... [https://www.sciencedirect.com/science/article/abs/pii/S2352152X25004426]
- 35. What is the Difference Between Supercapacitors and ... [https://www.azonano.com/article.aspx?ArticleID=6519]
- 36. energy storage technologies comparison: Top 5 Powerful ... [https://compassenergystorage.com/energy-storage-technologies-comparison/]
- 37. Supercapacitors 2026-2036: Technologies, Applications ... [https://www.idtechex.com/en/research-report/supercapacitors/1115]
- 38. Development and Experimental Validation of a ... [https://www.mdpi.com/1996-1073/13/5/1156]
- 39. Comparative study of methods for measuring energy ... [https://www.sciencedirect.com/science/article/abs/pii/S0167577X25006421]
- 40. Review of Energy Storage Capacitor Technology [https://www.mdpi.com/2313-0105/10/8/271]
- 41. Lead-free relaxor ferroelectric thin films with enhanced ... [https://www.nature.com/articles/s43246-025-00968-z]
- 42. High energy density MIM-type aluminum electrolytic ... [https://www.sciencedirect.com/science/article/abs/pii/S2405829725002557]
- 43. Supercapacitor Constant-Current and Constant-Power ... [https://www.mdpi.com/1996-1073/16/10/4167]
- 44. Developing an innovative theoretical model for analyzing ... [https://www.sciencedirect.com/science/article/abs/pii/S0013468625007261]
- 45. Comparison of methods for characterizing charge leakage ... [https://www.sciencedirect.com/science/article/abs/pii/S2352152X24047649]
- 46. Supercapacitor Constant-Current and Constant-Power ... [https://ideas.repec.org/a/gam/jeners/v16y2023i10p4167-d1149952.html]
- 47. Achieving high-performance parameters in NASICON-polymer ... [https://pubs.rsc.org/en/content/articlehtml/2025/ra/d4ra08292c]
- 48. Boosting supercapacitor performance through innovative ... [https://pubs.rsc.org/en/content/articlehtml/2025/ra/d5ra02905h]
- 49. A comparative study of supercapacitor capacitance ... [https://pmc.ncbi.nlm.nih.gov/articles/PMC7153758/]
- 50. Reevaluation of Performance of Electric Double-layer ... [https://www.nature.com/articles/srep38568]
- 51. Research on reliability of capacitors and transistors based ... [https://pmc.ncbi.nlm.nih.gov/articles/PMC12141725/]
- 52. All-solid-state High Voltage Pulse Power Supply [https://www.archivemarketresearch.com/reports/all-solid-state-high-voltage-pulse-power-supply-704050]
- 53. Decoding Market Trends in All-solid-state High Voltage ... [https://www.marketreportanalytics.com/reports/all-solid-state-high-voltage-pulse-power-supply-229187]
- 54. Renewable energy integration with electric vehicle ... [https://www.sciencedirect.com/science/article/pii/S1364032123003751]
- 55. Energy Storage Solutions in 2025: What's New? [https://www.thebatteryshow.asia/energy-storage-solutions-in-2025-whats-new/]
- 56. Next-Generation Profiles Project Makes Electric Vehicle ... [https://www.nrel.gov/news/detail/program/2024/next-generation-profiles-project-makes-electric-vehicle-high-power-charging-safer-reliable]
- 57. Supercapacitors Market Growth & Forecast 2025-2032 [https://www.persistencemarketresearch.com/market-research/supercapacitors-market.asp]
- 58. New supercapacitor technology promises double energy ... [https://www.electrichybridvehicletechnology.com/news/new-supercapacitor-technology-promises-double-energy-density-for-hevs.html]
- 59. Lithium-ion capacitors for use in energy storage systems: A ... [https://www.sciencedirect.com/science/article/abs/pii/S2352152X25040563]
- 60. Ultracapacitors Market - Industry Analysis (2025-2032) [https://www.stellarmr.com/report/ultracapacitors-market/2491]
- 61. Supercapacitors Industry Research Report 2025-2035 [https://finance.yahoo.com/news/supercapacitors-industry-research-report-2025-125300751.html]
- 62. Cell Roadmap [https://www.batterydesign.net/battery-cell/roadmap/]
- 63. Will 2025 Be a 'Solid' Year for EV Batteries? - Tech Insights [https://eepower.com/tech-insights/will-2025-be-a-solid-year-for-ev-batteries/]
- 64. Energy storage devices combining functionalities of battery ... [https://www.sciencedirect.com/science/article/abs/pii/S2352152X25029780]
- 65. Energy density normalization techniques for comparative ... [https://atomfair.com/battery-primer/article.php?id=G31-588]
- 66. An Ultra-High-Energy Density Supercapacitor; Fabrication ... [https://pmc.ncbi.nlm.nih.gov/articles/PMC6409971/]
- 67. Bridging MOFs and MXenes: from synthesis to environmental ... [https://pubs.rsc.org/en/content/articlehtml/2025/cp/d5cp02795k]
- 68. MXene/MOF-Derived Composites with Multidimensional ... [https://www.mdpi.com/2079-4991/15/11/841]
- 69. High density 3D-structured graphene for long-life and ... [https://www.sciencedirect.com/science/article/abs/pii/S0378775325013291]
- 70. A forestry waste-derived lithium ion capacitor: Sustainable, ... [https://www.sciencedirect.com/science/article/pii/S037877532401913X]
- 71. Graphene Batteries Market Trends and Investment [https://www.globenewswire.com/news-release/2025/08/20/3136282/28124/en/Graphene-Batteries-Market-Trends-and-Investment-Opportunities-2025-2034.html]
- 72. Functional carbon materials from waste plastics [https://www.maxapress.com/article/doi/10.48130/scm-0025-0005?viewType=HTML]
- 73. Density functional theory insights into the solvent effect on the ... [https://pubs.rsc.org/en/content/articlehtml/2025/ra/d5ra08324a]
- 74. Battery-Supercapacitor Hybrid Energy Storage Systems [https://stg.patent-art.com/knowledge-center/battery-supercapacitor-hybrid-energy-storage-systems/]
- 75. Advanced control strategy based on hybrid energy storage ... [https://www.nature.com/articles/s41598-025-23283-6]
- 76. Boosting energy storage density of lithium-ion hybrid ... [https://pubs.rsc.org/en/content/articlehtml/2025/ra/d5ra06831b]
- 77. Advancing energy storage: The future trajectory of lithium- ... [https://www.sciencedirect.com/science/article/pii/S2352152X25012241]
- 78. Supercapacitors Market Outlook 2025-2032 [https://www.intelmarketresearch.com/supercapacitors-market-14655]
- 79. A review of supercapacitors: Materials, technology, ... [https://www.sciencedirect.com/science/article/pii/S2352152X24021492]
- 80. Thermoset Polymer Dielectric Capacitors for Harsh ... [https://passive-components.eu/thermoset-polymer-dielectric-capacitors-for-harsh-environment-applications/]
- 81. Harsh Environments Conquered—Low Power, Precision ... [https://www.analog.com/en/resources/technical-articles/harsh-environments-conquered.html]
- 82. Reliability-oriented optimization of aluminum electrolytic ... [https://www.sciencedirect.com/science/article/abs/pii/S0026271420305527]
- 83. Robust lead-free capacitor ceramics for harsh electronic ... [https://www.sciencedirect.com/science/article/abs/pii/S1385894725086930]
- 84. Lifetime Estimation of Capacitors (Electrolytic, Film ... [https://www.aictech-inc.com/en/valuable-articles/capacitor_troubleshooting02c.html]
- 85. Thermal characteristic and performance influence of a ... [https://www.sciencedirect.com/science/article/abs/pii/S2352152X22011872]
- 86. Development of High Energy Density Multilayer Ceramic ... [https://sheffield.ac.uk/royce-institute/our-impact-case-studies/development-high-energy-density-multilayer-ceramic-capacitors]
- 87. High-Temperature Capacitors: Advancing Performance in ... [https://electronicsbuzz.in/high-temperature-capacitors-advancing-performance-in-extreme-environments/]
- 88. Ragone plots revisited: A review of methodology and ... [https://www.sciencedirect.com/science/article/pii/S2352152X23024957]
- 89. Energy density vs power density [https://energyeducation.ca/encyclopedia/Energy_density_vs_power_density]
- 90. Understanding Energy Density and Power ... [https://blog.knowlescapacitors.com/blog/understanding-energy-density-and-power-density-in-capacitor-applications]
- 91. | PPTX Ultracapacitors [https://www.slideshare.net/slideshow/ultracapacitors-27806458/27806458]
- 92. Supercapacitor vs Battery - Comparison and Case Study [https://circuitdigest.com/tutorial/supercapacitor-vs-battery-comparison-and-case-study]
- 93. Pseudocapacitive materials for energy storage: properties, ... [https://www.frontiersin.org/journals/chemistry/articles/10.3389/fchem.2025.1636683/full]
- 94. China connects its largest battery-supercapacitor hybrid ... [https://www.ess-news.com/2025/09/18/china-connects-its-largest-battery-supercapacitor-hybrid-storage-plant/]
- 95. Electric Double-layer Capacitor (EDLC) Market Size & ... [https://www.mordorintelligence.com/industry-reports/electric-double-layer-capacitor-market]
- 96. Electric Double Layer Capacitor Market to Surpass USD ... [https://finance.yahoo.com/news/electric-double-layer-capacitor-market-060000971.html]
- 97. Performance comparison between supercapacitors and ... [https://www.isemipower.com/blog/Performance-comparison-between-supercapacitors-and-traditional-batteries.]
- 98. Supercapacitors Statistics and Facts (2025) [https://scoop.market.us/supercapacitors-statistics/]
- 99. Hybrid Capacitor Market Size, Share & Industry Trends ... [https://www.gminsights.com/industry-analysis/hybrid-capacitor-market]
- 100. Electric Vehicles MLCC Market Size & Growth to 2030 [https://www.mordorintelligence.com/industry-reports/electric-vehicles-mlcc-market]
- 101. Supercapacitor vs Capacitor: What Is The Difference? [https://www.ultrafastcap.com/post/supercapacitor-vs-capacitor-what-is-the-difference]
- 102. Capacitors vs Supercapacitors: A Comparison of Energy Storage Solutions [https://ushapower.com/blog/capacitors-vs-supercapacitors/]
- 103. The Large-Scale Manufacturing of Polymer Dielectric ... [https://pubmed.ncbi.nlm.nih.gov/40091398/]
- 104. High temperature stable capacitive energy storage up to ... [https://www.sciencedirect.com/science/article/abs/pii/S2211285525000102]
- 105. High energy density solid state symmetric supercapacitors ... [https://pubs.rsc.org/en/content/articlehtml/2025/ra/d4ra07417c]
- 106. Technology readiness level [https://en.wikipedia.org/wiki/Technology_readiness_level]
- 107. Technology Readiness Levels for Battery Development [https://amprius.com/battery-trl/]
- 108. Technology Readiness Levels [https://www.nasa.gov/directorates/somd/space-communications-navigation-program/technology-readiness-levels/]
- 109. Capacitor types and performance [https://www.newark.com/capacitor-types-and-performance]
- 110. Capacitors in Power Electronics: A Simple Selection Guide [https://www.aictech-inc.com/en/valuable-articles/capacitor_appllication01a.html]
- 111. Polymer Aluminum Electrolytic Capacitors - Comparison ... [https://www.murata.com/en-us/products/capacitor/polymer/overview/basic/comparison]
- 112. Top 5 Capacitor Types for Industrial & Commercial Use [https://ushapower.com/blog/top-5-capacitor-types-for-industrial-and-commercial-use/]
- 113. Market Review of Energy Storage Systems [https://www.victanis.com/market-review-of-energy-storage-systems]
- 114. Lithium Ion Hybrid Capacitor Analysis 2025 and Forecasts ... [https://www.archivemarketresearch.com/reports/lithium-ion-hybrid-capacitor-832135]
- 115. Hybrid Supercapacitor Market Size, Share & Trends, 2025- ... [https://www.snsinsider.com/reports/hybrid-supercapacitor-market-7914]
- 116. Boosting energy storage density of lithium-ion hybrid ... [https://pmc.ncbi.nlm.nih.gov/articles/PMC12522198/]
- 117. Experimental and theoretical investigation of silicon-based ... [https://www.sciencedirect.com/science/article/abs/pii/S0925838824022527]
- 118. High performance Li-ion battery-type hybrid supercapacitor ... [https://www.sciencedirect.com/science/article/abs/pii/S2352152X23001536]
- 119. A high performance lithium ion capacitor achieved by the ... [https://www.nature.com/articles/srep40990]
- 120. Lithium Supercapacitor Strategic Insights: Analysis 2025 ... [https://www.archivemarketresearch.com/reports/lithium-supercapacitor-832231]
- 121. Battery-Type Lithium-Ion Hybrid Capacitors: Current Status ... [https://www.mdpi.com/2313-0105/9/2/74]