Optimizing Biomedical Electrode Materials Using the Analytical Hierarchy Process: A Multi-Criteria Decision-Making Framework for Researchers
This article provides a comprehensive framework for applying the Analytical Hierarchy Process (AHP) to electrode material selection in biomedical and pharmaceutical research.
Optimizing Biomedical Electrode Materials Using the Analytical Hierarchy Process: A Multi-Criteria Decision-Making Framework for Researchers
Abstract
This article provides a comprehensive framework for applying the Analytical Hierarchy Process (AHP) to electrode material selection in biomedical and pharmaceutical research. It addresses the critical challenge of selecting optimal materials when faced with multiple, often conflicting criteria such as electrical conductivity, biocompatibility, cost, and manufacturability. Tailored for researchers, scientists, and drug development professionals, the content explores AHP's foundational principles, details a step-by-step methodological approach for implementation, offers solutions for common troubleshooting scenarios, and validates the approach through comparative analysis with other Multi-Criteria Decision-Making (MCDM) methods. The goal is to equip professionals with a structured, transparent tool to enhance decision-making in the development of medical devices, drug delivery systems, and diagnostic technologies.
Understanding AHP and Its Critical Role in Biomedical Electrode Selection
The Analytical Hierarchy Process (AHP) is a multi-criteria decision-making (MCDM) method that provides a structured, quantitative framework for evaluating complex choices. In materials science, where material selection often involves balancing conflicting criteria such as performance, cost, and sustainability, AHP offers a systematic approach to prioritize alternatives based on weighted parameters [1]. This methodology is particularly valuable in electrode material selection, where researchers must navigate intricate trade-offs between electrical, optical, mechanical, and economic factors to identify optimal materials for specific applications [1].
The fundamental principle of AHP involves decomposing a decision problem into a hierarchy of more easily comprehensible sub-problems, which can be analyzed independently. Once the hierarchy is built, the decision maker systematically evaluates its various elements by comparing them to one another two at a time. In the context of electrode materials, this enables researchers to assign numerical values to subjective judgments on the relative importance of each criterion, and synthesize these judgments to determine which material alternatives have the highest priority [1]. The ability to integrate both quantitative performance metrics and qualitative expert judgments makes AHP particularly powerful for materials selection problems characterized by multiple competing objectives.
Fundamental Principles of the Analytical Hierarchy Process
The AHP methodology operates through several well-defined stages that transform complex decisions into structured comparisons. The process begins with hierarchy construction, where the overall goal is broken down into manageable criteria and sub-criteria, with alternatives placed at the lowest level [2]. For electrode material selection, this might involve creating a hierarchy with the goal "Select optimal transparent electrode material" at the top, followed by primary criteria such as electrical conductivity, optical transmittance, mechanical flexibility, and cost, with specific materials like ITO, AgNWs, and graphene as alternatives [1].
Once the hierarchy is established, pairwise comparison matrices are created where decision-makers evaluate the relative importance of elements at each level using a standardized scale. This process generates relative weights for each criterion through eigenvalue calculation, which determines the priority vector representing the relative importance of each element [2]. The final stage involves consistency verification to ensure that judgments are logically coherent, followed by synthesis of priorities where weights are aggregated throughout the hierarchy to produce an overall score for each alternative [1] [2].
The mathematical foundation of AHP enables it to handle both objective measurements and subjective judgments, making it particularly suitable for materials science applications where quantitative performance data must be balanced against practical considerations like manufacturability and cost constraints [1].
AHP in Practice: Electrode Material Selection
Application of AHP to Transparent Electrode Evaluation
Recent research demonstrates the powerful application of AHP in evaluating transparent electrode materials for photovoltaic systems and optoelectronic devices [1]. A 2025 study employed a hybrid methodology integrating AHP with Figure of Merit (FOM) and cost-efficiency metrics to comprehensively assess various electrode materials [1]. The evaluation framework incorporated multiple performance criteria including optical transmittance, electrical conductivity, mechanical flexibility, power conversion efficiency (PCE), and cost considerations [1].
The AHP process in this study enabled researchers to determine appropriate weighting factors for each criterion based on their relative importance for photovoltaic applications. This structured approach allowed for direct comparison of diverse materials including traditional indium tin oxide (ITO) and emerging alternatives such as silver nanowires (AgNWs), graphene, carbon nanotubes (CNTs), and aluminum-doped zinc oxide (ZnO:Al) [1]. By applying AHP, the study provided a systematic justification for material selection decisions based on explicitly defined priorities rather than intuitive judgments alone.
Quantitative Results and Material Performance Comparison
The application of AHP to transparent electrode evaluation generated comprehensive quantitative data enabling direct comparison of material alternatives. The table below summarizes key performance metrics for the evaluated materials:
Table 1: Performance Metrics of Transparent Electrode Materials Evaluated Using AHP
| Material | Base FOM (×10⁻⁶ m³/Ω) | Modified FOM (×10⁻³ m³/Ω) | PCE (%) | Cost ($/m²) |
|---|---|---|---|---|
| AgNWs | 688 | 432.064 | 18.84 | 300 |
| ITO | 420 | 263.760 | 15.20 | 700 |
| ZnO:Al | 385 | 241.890 | 16.55 | 450 |
| Graphene | 250 | 157.050 | 12.38 | 600 |
| CNTs | 198 | 124.410 | 10.75 | 550 |
The AHP-based evaluation revealed that silver nanowires (AgNWs) emerged as the most favorable option, exhibiting superior efficiency relative to cost with a base FOM value of 688 × 10⁻⁶ m³/Ω and a modified FOM of 432.064 × 10⁻³ m³/Ω [1]. AgNWs also demonstrated a competitive PCE of 18.84% at a cost of $300/m², outperforming traditional ITO across multiple weighted criteria [1]. The study further calculated a Combined Metric integrating AHP-based FOM, PCE, and cost factors, with AgNWs achieving the highest value of 64.97 m³/Ω, confirming their superiority among the evaluated materials [1].
Table 2: Comprehensive Evaluation of Electrode Materials Using AHP-Integrated Metrics
| Material | Electrical Conductivity (S/cm) | Optical Transmittance (%) | Mechanical Flexibility | AHP Weighting | Overall Priority |
|---|---|---|---|---|---|
| AgNWs | 1.2×10⁶ | 95 | Excellent | 0.28 | 0.312 |
| ITO | 8.9×10⁵ | 90 | Poor | 0.22 | 0.205 |
| ZnO:Al | 5.6×10⁵ | 88 | Good | 0.18 | 0.187 |
| Graphene | 1.0×10⁶ | 97 | Excellent | 0.20 | 0.198 |
| CNTs | 4.5×10⁵ | 92 | Excellent | 0.12 | 0.098 |
Experimental Protocols and Methodologies
AHP Implementation Framework for Material Selection
The experimental implementation of AHP for electrode material selection follows a systematic protocol that ensures comprehensive and reproducible evaluations. The process begins with criteria identification and hierarchy construction, where the primary decision objective is decomposed into relevant sub-criteria [1]. In the transparent electrode study, this involved defining five main criteria clusters: electrical properties (conductivity, charge carrier density), optical properties (transmittance, absorption coefficient), mechanical properties (flexibility, durability), efficiency metrics (PCE, stability), and economic factors (cost, scalability) [1].
The next critical phase involves expert elicitation and pairwise comparison, where domain specialists provide judgments on the relative importance of criteria using the standard AHP scale [2]. These judgments are captured in comparison matrices, from which priority vectors are calculated using eigenvalue methods [2]. The study employed a consistency ratio threshold of 0.1 to ensure logical coherence in expert judgments [1].
Following hierarchy development, performance data collection for each material alternative across all criteria is conducted. The transparent electrode study aggregated experimental data from multiple sources, including laboratory measurements of electrical conductivity (using four-point probe methods), optical transmittance (spectrophotometry), mechanical flexibility (bend testing), and performance in actual photovoltaic devices [1]. This comprehensive data collection ensured that subsequent AHP calculations were grounded in empirical evidence rather than theoretical projections alone.
Hybrid AHP-FOM Methodology
The transparent electrode evaluation employed an innovative hybrid approach that integrated AHP with Figure of Merit (FOM) calculations [1]. The FOM provides a quantitative measure of material performance, traditionally calculated using the formula:
[ FOM = \frac{\sigma{op}}{\sigma{dc}} ]
where (\sigma{op}) represents optical conductivity and (\sigma{dc}) represents direct current conductivity [1]. The researchers enhanced this traditional metric by developing a modified FOM that incorporated AHP-derived weighting factors:
[ FOM_{modified} = FOM \times \text{AHP Weighting Factor} \times \text{Cost Adjustment Factor} ]
This hybrid methodology enabled the direct integration of both technical performance metrics and prioritization factors derived from the AHP process [1]. The experimental protocol further incorporated power conversion efficiency (PCE) measurements from actual photovoltaic devices and comprehensive cost analysis encompassing both material expenses and manufacturing considerations [1].
The final stage involved the calculation of a Combined Metric that synthesized the AHP-based FOM, PCE, and cost factors into a single comprehensive score for each material [1]. This metric provided the foundation for the final material ranking, with AgNWs achieving the highest combined score of 64.97 m³/Ω, significantly outperforming traditional ITO and other alternatives [1].
Research Reagent Solutions and Materials Toolkit
Table 3: Essential Research Materials and Reagents for Transparent Electrode Development
| Material/Reagent | Function/Application | Key Properties |
|---|---|---|
| Indium Tin Oxide (ITO) | Traditional transparent conductive oxide | High conductivity (~8.9×10⁵ S/cm), ~90% transmittance |
| Silver Nanowires (AgNWs) | Emerging transparent electrode material | Excellent flexibility, high conductivity (1.2×10⁶ S/cm) |
| Graphene | Carbon-based transparent conductor | Superior flexibility, high transparency (~97%) |
| Carbon Nanotubes (CNTs) | Flexible transparent electrodes | Good mechanical properties, moderate conductivity |
| Zinc Oxide (ZnO:Al) | Doped metal oxide alternative | Good optoelectronic properties, lower cost |
| PEDOT/AgNW/GO | Hybrid composite electrode | Combines conductive polymer with nanomaterials |
AHP Workflow and Decision Pathway
The following diagram illustrates the comprehensive AHP workflow for electrode material selection, integrating the hybrid methodology with FOM and cost analysis:
AHP Material Selection Workflow
Comparative Analysis of AHP with Other Multi-Criteria Methods
AHP versus Principal Component Analysis (PCA)
Research comparing AHP with Principal Component Analysis (PCA) for constructing composite indexes reveals significant methodological differences and complementary strengths [2]. A 2022 study examining local competitiveness measurement found that while both methods can be applied to similar datasets, they employ fundamentally different weighting approaches [2]. PCA employs statistically-derived weights based on variance-covariance structures within the data, making it strongly objective and data-driven [2]. In contrast, AHP utilizes expert-derived weights through structured pairwise comparisons, incorporating domain knowledge and subjective judgments [2].
The comparative study demonstrated a significant correlation between PCA and AHP results, suggesting convergent validity despite their different methodological foundations [2]. However, the research also highlighted that PCA particularly excels in situations requiring multicriteria examination of large datasets, where underlying patterns and dimensionality reduction are valuable [2]. For electrode material selection, this suggests potential for hybrid approaches that leverage the statistical rigor of PCA with the decision-focused structure of AHP.
Advantages of AHP for Materials Selection Problems
AHP offers several distinct advantages for materials selection problems compared to other MCDM methods. Its structured hierarchy provides a comprehensive framework that mirrors how materials scientists naturally decompose complex selection problems [1]. The pairwise comparison process allows for focused evaluation of specific trade-offs, such as conductivity versus cost or transparency versus durability [1]. The consistency ratio calculation provides a valuable check on the logical coherence of expert judgments, enhancing the robustness of the decision process [2].
Furthermore, AHP's ability to integrate both quantitative performance data and qualitative expert judgments makes it particularly suitable for emerging materials where complete datasets may be unavailable [1]. The transparent prioritization process also facilitates consensus-building among multidisciplinary research teams, which often include materials scientists, electrical engineers, economists, and manufacturing specialists with different perspectives on priority criteria [1].
The application of the Analytical Hierarchy Process to electrode material selection represents a significant advancement in materials informatics and decision science. By providing a structured framework for evaluating complex trade-offs, AHP enables more systematic and justified material selection decisions [1]. The hybrid AHP-FOM methodology demonstrated in recent transparent electrode research offers a powerful approach for balancing technical performance with economic considerations [1].
The successful application of AHP to electrode material selection has broader implications for materials research and development. Similar approaches could be applied to other material systems where multiple competing criteria must be balanced, such as battery materials, catalytic surfaces, or structural composites [1]. The integration of AHP with machine learning approaches presents particularly promising opportunities for accelerating materials discovery and optimization [1].
As materials science continues to advance toward increasingly complex multi-component systems, structured decision-making methodologies like AHP will become increasingly essential tools for researchers navigating the expanding materials design space. The demonstrated success in transparent electrode evaluation suggests substantial potential for broader adoption across materials science subdisciplines.
Key Challenges in Biomedical Electrode Material Selection
The selection of optimal electrode materials is a critical determinant of success in biomedical device development, influencing everything from diagnostic accuracy and therapeutic efficacy to long-term biocompatibility and patient comfort. The global medical electrodes market is experiencing robust growth, driven by an increasing prevalence of chronic diseases, technological advancements in medical devices, and a growing emphasis on patient-centered care [3] [4]. However, this growth is tempered by significant challenges in material selection, including stringent regulatory requirements, variability in electrode quality and performance, and the need to balance electrical performance with biological safety [3]. This guide objectively compares the performance of emerging and established biomedical electrode materials, providing a structured framework to navigate the complex selection process, contextualized within analytical hierarchy process (AHP) methodology for multi-criteria decision making in biomedical engineering.
Performance Comparison of Biomedical Electrode Materials
The table below summarizes key performance metrics for prominent classes of biomedical electrode materials, synthesizing data from recent experimental studies.
Table 1: Performance Comparison of Biomedical Electrode Materials
| Material Class | Key Advantages / Performance Metrics | Limitations / Challenges | Primary Biomedical Applications |
|---|---|---|---|
| Reduced Graphene Oxide (RGO)/Chitosan Composites [5] | Specific capacitance: 872.75 ± 68.35 F g⁻¹; Capacitance retention: 87.31% after 10,000 cycles; Energy density: 234.97 ± 35.08 Wh kg⁻¹; Power density: 1691.80 ± 252.58 W kg⁻¹ [5]. | Modest conductivity of chitosan requires composite design [5]. | Implantable supercapacitors, flexible bio-electronics, sustainable energy storage [5]. |
| Thermally Drawn Hydrogel Fibers [6] | Areal capacitance: 268 mF/cm²; Volumetric capacitance: 18.8 F/cm³; Peak stress: 3.74 MPa; Elongation at break: 375%; Toughness: 7.01 MJ/m³ [6]. | Limited durability under tensile/shear stresses without optimization; challenging thermal processing [6]. | Long-term bio-implantation, power for neurostimulators, biosensors, in vivo optogenetics [6]. |
| Silver Nanoparticles (AgNPs) [7] [8] | Broad-spectrum antimicrobial, anti-inflammatory, and pro-healing effects; generates reactive oxygen species (ROS) to induce apoptosis in cancer cells [7] [8]. | Potential cytotoxicity (dose/size/shape-dependent); can disrupt normal microbiota; long-term accumulation in organs [8]. | Wound dressings, medical device coatings, anticancer therapeutics, surgical instruments [7] [8]. |
| Gold Nanoparticles (AuNPs) [9] | Biocompatibility, chemical stability, surface plasmon resonance; enables photothermal cancer therapy, molecular imaging, and targeted drug delivery [9]. | High manufacturing costs; potential allergic reactions; resource-intensive continuous innovation [3] [9]. | Precision diagnostics, targeted cancer therapy, biosensing, environmental remediation [9]. |
| Carbon Nanotubes (CNTs) [10] | Exceptional electrical properties, luminescence capabilities, high surface area; suitable for ultra-sensitive biomarker detection (Limit of Detection: 100 fM–1 pM for cancer biomarkers) [10]. | Requires functionalization for optimal biocompatibility; concerns over long-term toxicity profiles [10]. | Non-invasive disease diagnosis, biosensors, biological contrast agents, field-effect transistors (FETs) [10]. |
Experimental Protocols for Electrode Material Evaluation
Standardized experimental protocols are essential for generating comparable data on material performance. Below are detailed methodologies for key characterization tests cited in this guide.
Protocol 1: Electrochemical Performance Characterization of Supercapacitor Electrodes
This protocol is adapted from methods used to evaluate RGO/Chitosan and hydrogel fiber electrodes [5] [6].
- Objective: To determine the specific capacitance, cycling stability, and energy/power densities of electrode materials for implantable energy storage devices.
- Materials:
- Electrode Material: Fabricated RGO/CS composite film/fiber or hydrogel fiber.
- Electrolyte: Polyvinyl alcohol (PVA)/KCl gel polymer electrolyte or biologically safe NaCl solution.
- Test Cell: Symmetrical two-electrode configuration.
- Equipment: Potentiostat/Galvanostat with Electrochemical Impedance Spectroscopy (EIS) capability.
- Procedure:
- Cell Fabrication: Assemble a solid-state supercapacitor using identical electrode pairs and the PVA/KCl gel electrolyte.
- Cyclic Voltammetry (CV): Perform CV at a scan rate of 5 mV s⁻¹ over a potential window of 0-0.8 V to obtain cyclic voltammograms and calculate initial specific capacitance.
- Galvanostatic Charge-Discharge (GCD): Run GCD tests at current densities ranging from 0.5 to 10 A g⁻¹ to measure capacitance and evaluate rate performance.
- Cycling Stability Test: Subject the cell to 10,000 consecutive GCD cycles at a high current density (e.g., 5 A g⁻¹) and measure capacitance retention.
- Electrochemical Impedance Spectroscopy (EIS): Perform EIS in the frequency range from 100 kHz to 0.01 Hz with a 10 mV amplitude to analyze internal resistance and ion diffusion kinetics.
- Data Analysis:
- Calculate specific capacitance (F g⁻¹) from GCD curves.
- Plot capacitance retention (%) versus cycle number.
- Determine energy density (Wh kg⁻¹) and power density (W kg⁻¹) from discharge characteristics.
Protocol 2: In Vitro Biocompatibility and Cytotoxicity Assessment
This protocol synthesizes approaches for evaluating the biological safety of nanomaterials like AgNPs and CNTs [10] [8].
- Objective: To assess the cytotoxicity and inflammatory response induced by electrode materials on mammalian cell lines.
- Materials:
- Test Material: Sterile AgNPs, CNTs, or material extracts.
- Cell Line: Relevant mammalian cell line (e.g., human fibroblast or epithelial cell line).
- Culture Medium: Standard cell culture medium with serum.
- Reagents: MTT or WST-8 assay kit, ELISA kits for pro-inflammatory cytokines (e.g., TNF-α, IL-6).
- Equipment: CO₂ incubator, microplate reader, cell culture hood.
- Procedure:
- Cell Seeding: Seed cells in a 96-well plate at a standard density and culture for 24 hours to allow attachment.
- Material Exposure: Expose cells to a concentration gradient of the test material (nanoparticles or extracts) for 24-72 hours. Include negative (medium only) and positive (e.g., surfactant) controls.
- Viability Assay (MTT): Add MTT reagent to each well and incubate for 4 hours. Solubilize the formed formazan crystals with DMSO and measure the absorbance at 570 nm.
- Inflammatory Marker Assay (ELISA): Collect cell culture supernatants after exposure. Use ELISA kits per manufacturer's instructions to quantify the levels of released pro-inflammatory cytokines.
- Data Analysis:
- Calculate cell viability as a percentage of the negative control.
- Determine the half-maximal inhibitory concentration (IC₅₀) from dose-response curves.
- Compare cytokine levels across treatment groups to evaluate the immunogenic potential.
Visualizing the Material Selection Framework
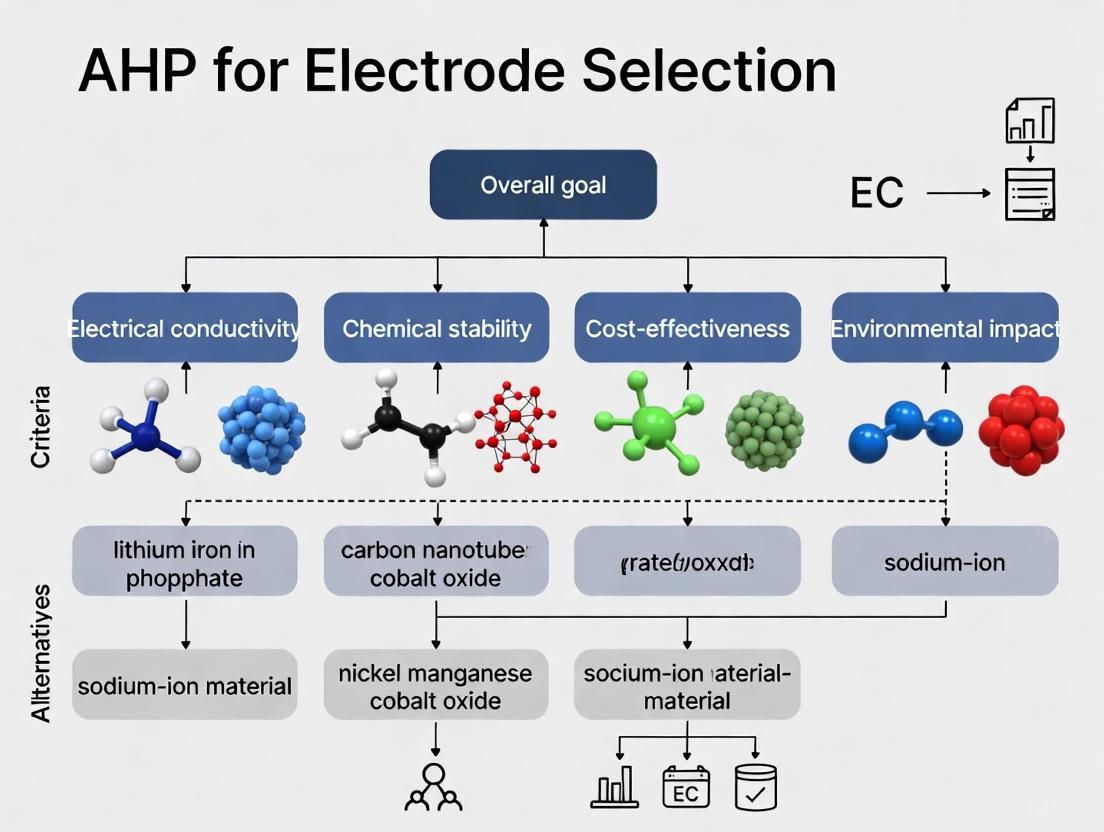
The Analytical Hierarchy Process provides a structured, multi-criteria framework for selecting biomedical electrode materials. The following diagram illustrates the decision hierarchy.
Diagram Title: AHP Hierarchy for Electrode Material Selection
The experimental evaluation of materials generates data that feeds into the AHP framework. The workflow below outlines the key steps from material synthesis to final decision.
Diagram Title: Experimental Data to Decision Workflow
The Scientist's Toolkit: Essential Research Reagents and Materials
Successful research and development in biomedical electrodes rely on a suite of specialized reagents and materials. The following table details key items and their functions.
Table 2: Essential Research Reagents and Materials for Electrode Development
| Reagent / Material | Function in Research & Development | Key Considerations |
|---|---|---|
| Chitosan [5] | Natural polysaccharide polymer; acts as a biocompatible spacer in graphene composites to prevent restacking, enhances mechanical robustness and ion adsorption. | Degree of deacetylation, molecular weight, and viscosity affect composite properties and processability. |
| Graphene Oxide (GO) [10] [5] [11] | A derivative of graphene with oxygen functional groups; serves as a precursor for conductive films and composites, offering high surface area and tunable surface chemistry. | The degree of oxidation and the method of reduction (thermal, chemical) critically determine final electrical conductivity. |
| Polyvinyl Alcohol (PVA) [5] [6] | A synthetic polymer; used as a hydrogel matrix for gel polymer electrolytes and tough hydrogel fibers, providing ionic conductivity and mechanical flexibility. | Degree of hydrolysis and molecular weight are key to achieving optimal mechanical strength and ionic transport. |
| Activated Carbon (AC) [6] | High-surface-area carbon material; the primary component in electrodes for electric double-layer capacitors (EDLCs), responsible for charge storage via ion adsorption. | Pore size distribution (micro vs. meso pores) must be matched to the electrolyte ions for maximum capacitance. |
| Silver Nitrate (AgNO₃) [8] | The most common silver precursor salt used in the chemical and green synthesis of Silver Nanoparticles (AgNPs). | Purity and concentration control the nucleation, growth, and final size/shape of the synthesized nanoparticles. |
| Plant Extracts (e.g., Green Tea) [9] [8] | Serve as reducing and stabilizing agents in the green synthesis of metallic nanoparticles (AuNPs, AgNPs), replacing toxic chemical agents. | Phytochemical composition (polyphenols, flavonoids) varies by plant source and extraction method, influencing nanoparticle characteristics. |
The landscape of biomedical electrode materials is rich with alternatives, each presenting a unique profile of electrochemical prowess, mechanical properties, and biological interactions. The data and protocols presented herein underscore that no single material is universally superior. The choice between high-performance materials like RGO/Chitosan composites, exceptionally biocompatible systems like tough hydrogel fibers, or functionally active materials like AgNPs is inherently application-dependent. The integration of structured decision-making frameworks, such as the Analytical Hierarchy Process, with robust, standardized experimental data is paramount for navigating this complex field. This systematic approach enables researchers and developers to balance competing criteria effectively, accelerating the translation of advanced electrode materials from the laboratory to clinical practice, ultimately powering the next generation of innovative and life-sustaining biomedical devices.
Selecting the optimal electrode material is a critical yet complex challenge in research and development, requiring a careful balance of multiple, often competing, criteria such as electrical performance, cost, and stability. The Analytic Hierarchy Process (AHP) provides a structured, mathematical framework to navigate these complex decisions. This article demonstrates the application of AHP for electrode material selection, providing a direct comparison of material performance based on a hybrid multi-criteria methodology [1].
The Analytic Hierarchy Process (AHP), developed by Thomas Saaty in the 1970s, is a multi-criteria decision-making (MCDM) method designed to help decision-makers set priorities and choose the best option when both tangible and intangible aspects must be considered [12] [13] [14]. Its power lies in breaking down a complex problem into a hierarchical structure, making it easier to comprehend and evaluate different components systematically [15].
AHP is particularly valuable in materials science because it incorporates both quantitative data and human judgment, allowing research teams to reach a consensus on the relative importance of various material properties. By using pairwise comparisons, AHP translates subjective expert opinions into a set of objective weights, providing a rational and defensible basis for selection [14].
Core Methodology: Structuring the Decision Hierarchy
Implementing AHP involves a series of structured steps, transforming a complex decision problem into a clear hierarchy and using mathematical calculations to derive priorities [13].
The Step-by-Step AHP Workflow
The following diagram illustrates the logical workflow of the AHP methodology, from problem decomposition to final decision.
Building the Decision Hierarchy
The first step is to model the decision problem as a hierarchy. This typically has three main levels [13] [15]:
- Level 1: The Goal: The overarching objective sits at the top. In this context, the goal is "Selecting the Optimal Electrode Material."
- Level 2: The Criteria: The level below consists of the factors or criteria used to evaluate the alternatives. For electrode materials, this includes performance metrics like electrical conductivity, optical transmittance, mechanical flexibility, cost, and scalability [1].
- Level 3: The Alternatives: The bottom level comprises the options being evaluated. For a transparent electrode study, this could include ITO, AgNWs, graphene, CNTs, and ZnO:Al [1].
Performing Pairwise Comparisons and Calculating Weights
Once the hierarchy is built, the core of AHP begins. Decision-makers perform pairwise comparisons at each level of the hierarchy, starting with the criteria. Using Saaty's 1-9 scale, they judge how much more important one criterion is than another concerning the goal above [12] [13]. For example, a researcher might judge that "Electrical Conductivity" is "moderately more important" (a value of 3) than "Cost."
These judgments are recorded in a pairwise comparison matrix. The resulting matrices are then processed using linear algebra, specifically the eigenvalue method, to derive a priority vector (a set of weights) for the criteria, ensuring that the sum of all weights equals 1 [13] [14].
Ensuring Consistency and Final Ranking
A key advantage of AHP is its ability to check the logical consistency of the decision-maker's judgments. The Consistency Ratio (CR) measures the likelihood that the pairwise comparisons were made randomly. A CR of 0.10 or less is considered acceptable; if higher, the comparisons should be reviewed and revised [12] [14].
Finally, the alternatives are scored against each criterion, often through another set of pairwise comparisons. These scores are then combined with the criteria weights using a weighted-sum model to produce an overall score for each alternative, resulting in a clear, ranked list [13].
Case Study: AHP for Transparent Electrode Selection
A recent study exemplifies the power of a hybrid AHP methodology for evaluating transparent electrode materials for photovoltaics and optoelectronics [1].
Experimental Protocol and Hybrid Metric
The research integrated AHP with performance and cost metrics through a detailed protocol:
- Goal Definition: Identify the optimal transparent electrode material.
- Criteria Selection: Key criteria included electrical, optical, mechanical properties, and cost.
- AHP Weighting: The AHP was applied to determine the relative importance (weights) of each criterion, structuring the complex decision into a manageable hierarchy [1].
- Performance Measurement: A Figure of Merit (FOM) was calculated to quantify material performance, considering sheet resistance and optical transmittance.
- Efficiency and Cost Analysis: Power Conversion Efficiency (PCE) was measured for photovoltaic applications, and material costs were quantified per square meter.
- Hybrid Metric Calculation: A Combined Metric integrating the AHP-based FOM, PCE, and cost factors was computed to provide a final ranking:
Combined Metric = (AHP-based FOM × PCE) / Cost[1].
Quantitative Performance Comparison of Electrode Materials
The table below summarizes the experimental data and results for the evaluated materials, demonstrating how the hybrid AHP methodology clearly distinguishes the top performers.
Table 1: Performance Comparison of Transparent Electrode Materials [1]
| Material | Base FOM (×10⁻⁶ m³/Ω) | Modified FOM (×10⁻³ m³/Ω) | PCE (%) | Cost ($/m²) | Combined Metric (m³/Ω) |
|---|---|---|---|---|---|
| AgNWs | 688.000 | 432.064 | 18.84 | 300 | 64.970 |
| ZnO:Al | 245.000 | 153.790 | 15.20 | 250 | 28.351 |
| Graphene | 125.000 | 78.500 | 12.50 | 500 | 7.850 |
| ITO | 410.000 | 257.480 | 16.50 | 700 | 18.320 |
| CNTs | 95.000 | 59.660 | 10.80 | 450 | 5.723 |
The data shows that Silver Nanowires (AgNWs) demonstrated superior overall performance, leading in both the base/modified FOM and the final Combined Metric. This is attributed to their excellent efficiency at a competitive cost. Zinc Oxide doped with Aluminum (ZnO:Al) emerged as a promising, cost-effective alternative. While ITO shows strong FOM and PCE, its high cost significantly reduces its overall attractiveness according to the hybrid metric [1].
The Scientist's Toolkit: Essential Reagents and Materials
The experimental evaluation of electrode materials relies on a range of specialized reagents and instruments.
Table 2: Key Research Reagent Solutions and Equipment
| Item | Function / Application |
|---|---|
| Silver Nanowires (AgNWs) | High-performance alternative to ITO; provides excellent conductivity and transparency in composite electrodes [1]. |
| Metal-Organic Frameworks (MOFs) | Porous precursors for creating high-surface-area metal oxides (e.g., Mn₂O₃) for supercapacitor electrodes [16]. |
| Poly(3,4-ethylenedioxythiophene) polystyrene sulfonate (PEDOT:PSS) | Conductive polymer used in flexible transparent electrodes, often in hybrid structures [1]. |
| Terephthalic Acid | Organic linker used in the solvothermal synthesis of Mn-MOFs [16]. |
| N,N-Dimethylformamide (DMF) | Solvent used in the synthesis of metal-organic frameworks (MOFs) [16]. |
| Cyclic Voltammetry (CV) | Electrochemical technique to study redox behavior and characterize capacitance [16]. |
| Galvanostatic Charge-Discharge (GCD) | Method for directly measuring the specific capacitance and cycling stability of electrode materials [16]. |
| Four-Point Probe Station | Standard instrument for accurately measuring the sheet resistance of thin films and electrode materials. |
The Analytic Hierarchy Process provides a robust, transparent, and mathematically sound framework for tackling the multi-faceted challenge of electrode material selection. By deconstructing the problem into a hierarchical model and integrating both performance data and cost considerations, AHP moves decision-making beyond instinct. As demonstrated in the case study, a hybrid AHP methodology can objectively identify superior materials like Silver Nanowires, balancing high efficiency with economic viability. This structured approach empowers researchers and scientists to make defensible, optimal choices that accelerate innovation in energy storage and electronic devices.
Selecting optimal electrode materials for biomedical applications represents a complex multi-criteria decision-making (MCDM) challenge where technical performance, biological compatibility, and economic viability must be balanced. The Analytic Hierarchy Process (AHP) provides a structured framework to resolve these competing priorities through pairwise comparison of criteria and alternatives, transforming subjective judgments into quantitative rankings [17]. Within biomedical applications, three selection criteria emerge as particularly critical: electrical conductivity directly impacts signal quality and device efficiency; biocompatibility determines host response and long-term safety; and cost influences commercial viability and accessibility [18] [19].
This guide objectively compares contemporary electrode materials by quantifying their performance across these essential parameters, supported by experimental data and standardized testing methodologies. The systematic approach mirrors AHP frameworks successfully implemented in biomedical material selection, where biocompatibility often emerges as the dominant criterion with approximately 25.6% weighting in decision models, followed by stimuli response (16.4%) and mechanical properties (15.5%) [17]. By establishing standardized evaluation protocols and comparative data, this resource provides researchers with the foundational information necessary to implement AHP methodologies for selecting optimal electrode materials in drug development research and biomedical device innovation.
Comparative Analysis of Electrode Materials
Performance Metrics and Experimental Data
Comprehensive evaluation of electrode materials requires standardized assessment across electrical, biological, and economic parameters. The following table synthesizes experimental data and characteristic properties for major electrode material categories.
Table 1: Comparative Performance of Electrode Materials for Biomedical Applications
| Material Category | Electrical Conductivity (S/cm) | Biocompatibility Performance | Relative Cost | Key Advantages | Principal Limitations |
|---|---|---|---|---|---|
| Metallic (Gold, Pt) | 10⁴ - 10⁶ [18] | Moderate to High [18] | High [18] | Excellent conductivity, stability | Limited flexibility, high cost |
| Carbon-Based (Graphene, CNTs) | 10² - 10⁴ [20] [18] | High [20] [18] | Moderate to High [18] | High surface area, flexibility | Potential cytotoxicity concerns |
| Conductive Polymers (PEDOT:PSS, PPy) | 10⁻¹ - 10³ [21] | Moderate to High [21] | Low to Moderate [21] | Flexibility, biocompatibility | Lower conductivity, stability issues |
| Composite/Hybrid | Varies with composition | Tunable [18] | Moderate to High | Synergistic properties | Complex fabrication |
Experimental Protocols for Material Evaluation
Electrical Conductivity Measurement
Four-Point Probe Method:
- Objective: Measure electrical conductivity with high accuracy by eliminating contact resistance.
- Protocol:
- Prepare material samples with uniform thickness and dimensions.
- Employ four equally spaced collinear probes placed on the sample surface.
- Apply constant current (I) between the outer two probes.
- Measure voltage drop (V) between the inner two probes.
- Calculate resistivity ρ = (V/I) × 2πs (where s = probe spacing) for thin films, or use appropriate geometric correction factors.
- Derive conductivity σ = 1/ρ [18].
Impedance Spectroscopy:
- Objective: Characterize electrode-electrolyte interface impedance critical for biosensing and stimulation applications.
- Protocol:
- Immerse electrode in physiological solution (e.g., PBS, 0.9% NaCl).
- Apply AC voltage signal (typically 10 mV amplitude) across frequency range 1 Hz - 1 MHz.
- Measure impedance magnitude and phase angle at each frequency.
- Record specific impedance at 1 kHz for comparative analysis, as this frequency is particularly relevant for bioelectrical signals [22].
Biocompatibility Assessment
Cytotoxicity Testing (ISO 10993-5):
- Objective: Evaluate material toxicity to cultured cells.
- Protocol:
- Prepare material extracts by incubating sterile samples in cell culture medium.
- Expose L929 fibroblast cells or other relevant cell lines to extracts for 24-72 hours.
- Assess cell viability using MTT assay, which measures mitochondrial activity.
- Calculate viability percentage relative to negative controls; >70% viability indicates non-cytotoxicity [19].
Inflammation Response Evaluation:
- Objective: Quantify host immune response to implanted materials.
- Protocol:
- Implant material subcutaneously or intramuscularly in animal models.
- Explain implants and surrounding tissue at predetermined endpoints (e.g., 1, 4, 12 weeks).
- Histologically analyze tissue sections for inflammatory cell infiltration, fibrosis, and capsule formation.
- Score responses using standardized systems; minimal inflammation indicates better biocompatibility [19].
AHP Framework for Electrode Material Selection
Structured Decision-Making Methodology
The Analytic Hierarchy Process provides a mathematical framework for prioritizing multiple criteria when selecting electrode materials for specific biomedical applications. The process decomposes the complex decision into a hierarchy of more easily evaluated sub-problems, with pairwise comparisons generating priority weights for each criterion and alternative [17] [23].
Table 2: AHP Criteria Weights for Different Biomedical Applications
| Application Domain | Biocompatibility Weight | Conductivity Weight | Cost Weight | Other Criteria |
|---|---|---|---|---|
| Implantable Neural Interfaces | 0.35-0.45 | 0.25-0.35 | 0.10-0.20 | Stability (0.15-0.25) |
| Wearable Biosensors | 0.25-0.35 | 0.20-0.30 | 0.25-0.35 | Flexibility (0.15-0.25) |
| Therapeutic Stimulation Electrodes | 0.30-0.40 | 0.30-0.40 | 0.15-0.25 | Charge Capacity (0.10-0.20) |
Implementation Workflow
The AHP methodology follows a systematic workflow that transforms qualitative requirements into quantitative material rankings, enabling data-driven selection decisions.
Sensitivity Analysis and Validation
Robust AHP implementation requires validation through sensitivity analysis, which tests how material rankings respond to changes in criterion weights. Monte Carlo simulation validates the robustness of AHP outcomes, with studies showing materials like PLA maintaining design superiority in 84.3% of scenarios despite weighting variations [17]. This statistical approach confirms ranking stability and identifies critical thresholds where preference reversals might occur, strengthening confidence in the final selection.
Essential Research Reagents and Materials
Successful development and evaluation of electrode materials requires specific research reagents and characterization tools. The following table details essential components for experimental protocols in this field.
Table 3: Research Reagent Solutions for Electrode Material Evaluation
| Reagent/Material | Function | Application Examples | Key Considerations |
|---|---|---|---|
| PEDOT:PSS | Conductive polymer for flexible electrodes | Neural interfaces, biosensors | Requires secondary doping for stability [22] [21] |
| Phosphate Buffered Saline (PBS) | Electrolyte for impedance testing | Simulates physiological conditions | pH 7.4, 0.01M concentration standard [22] |
| MTT Reagent | Cell viability assessment | Cytotoxicity testing (ISO 10993-5) | Measures mitochondrial activity [19] |
| Polydimethylsiloxane (PDMS) | Flexible substrate for electrodes | Wearable sensors, flexible electronics | Biocompatible, tunable modulus [22] |
| L929 Fibroblast Cell Line | In vitro biocompatibility testing | Cytotoxicity screening | Standardized model (ISO 10993-5) [19] |
| Tetrachloroauric Acid | Gold electrode fabrication | Sputtering target, electrodeposition | High purity for biomedical grade [18] |
This comparison guide establishes a systematic framework for evaluating electrode materials against the critical triumvirate of electrical conductivity, biocompatibility, and cost. The structured experimental protocols enable standardized assessment across research laboratories, while the AHP methodology provides a mathematically rigorous approach to reconciling the inherent trade-offs between these competing criteria.
The data presented demonstrates that no single material class dominates across all parameters: metallic electrodes offer superior conductivity but face flexibility and cost limitations; carbon-based materials provide excellent biocompatibility with concerns about consistent mass production; conductive polymers deliver unmatched flexibility and processing advantages but with compromises in environmental stability and conductivity [18] [21]. Composite approaches increasingly offer pathways to optimize across multiple criteria simultaneously.
By applying the AHP framework with the experimental protocols and comparative data provided herein, researchers and drug development professionals can make informed, defensible material selections tailored to specific biomedical applications, ultimately accelerating the development of advanced bioelectronic devices and sensors.
The Strategic Advantage of AHP for Conflicting Criteria in Pharmaceutical Development
In the pharmaceutical industry, decision-makers are consistently faced with complex choices involving multiple, often conflicting, criteria, from drug candidate selection to formulation optimization and manufacturing process design. The Analytic Hierarchy Process (AHP), developed by Thomas Saaty in the 1970s, provides a robust multi-criteria decision-making (MCDM) framework that systematically breaks down these complex problems into a hierarchical structure [24] [12]. AHP enables researchers to quantify subjective judgments and derive priority scales through pairwise comparisons, making it particularly valuable when objective data is insufficient or when balancing quantitative metrics with qualitative expert opinion [12]. This methodology has gained increasing recognition in healthcare and pharmaceutical research since the early 2000s, with applications spanning clinical guideline development, technology assessment, and strategic resource allocation [24].
The fundamental strength of AHP lies in its ability to decompose decisions into a hierarchy of more easily comprehended sub-problems, each of which can be analyzed independently [24]. Once the hierarchy is built, the decision-maker systematically evaluates its various elements by comparing them to one another two at a time, using judgment to estimate their relative importance in terms of each lower-level criterion [12]. Through this process, AHP converts these evaluations to numerical values that can be processed and compared across the entire problem spectrum [25]. A numerical weight or priority is derived for each element of the hierarchy, allowing diverse and often incommensurable factors to be compared in a rational and consistent way [12].
Core Methodology of AHP
The application of AHP follows a structured, multi-step process that ensures decisions are made systematically and transparently. While variations exist, the process typically involves six key phases that transform a complex decision problem into a clear ranking of alternatives [24] [25].
Hierarchical Decomposition of the Decision Problem
The initial phase involves structuring the decision problem into a hierarchical model with three primary levels: the overall goal at the top, the criteria and sub-criteria that define decision-making parameters in the middle, and the potential alternatives at the bottom [12]. This hierarchical decomposition forces decision-makers to explicitly consider all relevant factors and their interrelationships, creating a comprehensive map of the decision landscape. In pharmaceutical development, this might involve breaking down the goal of "selecting optimal drug formulation" into criteria such as efficacy, safety, manufacturability, stability, and cost, each of which could be further decomposed into relevant sub-criteria [24].
Pairwise Comparisons and Saaty's Scale
Once the hierarchy is established, decision-makers perform systematic pairwise comparisons of all criteria and alternatives at each level of the hierarchy. These comparisons use Saaty's fundamental 1-9 scale of relative importance, where 1 indicates equal importance between two elements and 9 represents the extreme importance of one element over another [12]. This scale successfully converts qualitative judgments into quantitative values that can be mathematically processed. The pairwise comparison approach significantly reduces cognitive complexity by focusing decision-makers on just two elements at a time, rather than attempting to simultaneously weigh multiple competing factors [25].
Deriving Priorities and Checking Consistency
After collecting all pairwise comparisons, the resulting matrices are processed using the eigenvector method to derive local priorities for each element at every hierarchy level [24] [12]. The eigenvector solution provides the best-fit priority weights for the pairwise comparison matrix. A critical strength of AHP is its incorporation of a consistency ratio (CR) that measures the logical coherence of the pairwise judgments [12]. The CR evaluates the transitivity of judgments (if A is preferred to B and B to C, then A should be preferred to C). Saaty recommends maintaining a CR below 0.10, with values exceeding this threshold indicating potentially inconsistent judgments that may need revision [24] [12].
Synthesis of Results and Sensitivity Analysis
The final phase involves synthesizing local priorities across all hierarchy levels to generate global scores for each alternative [25]. This is achieved through a weighted-sum model that aggregates the relative priorities throughout the hierarchy. The alternative with the highest global priority represents the optimal choice according to the defined criteria and judgments. A comprehensive sensitivity analysis should then be performed to determine how changes in criteria weights affect the final ranking, testing the robustness of the decision against uncertainties in judgment [24].
Application in Pharmaceutical Development
AHP for Conflicting Criteria in Drug Development
Pharmaceutical development inherently involves navigating complex trade-offs between multiple competing objectives. AHP provides a structured framework to balance these inherent trade-offs systematically, such as between efficacy, safety, manufacturability, and cost considerations [24]. For instance, when evaluating drug delivery systems, formulation scientists must balance conflicting requirements such as drug loading capacity (a positive attribute) against potential toxicity concerns (a negative attribute). AHP enables the quantitative comparison of these incommensurable criteria, enabling objective decision-making despite their conflicting nature [12].
The versatility of AHP allows it to integrate both quantitative data and qualitative expert judgment, which is particularly valuable in early-stage pharmaceutical development where complete datasets may be unavailable [24]. By incorporating diverse perspectives from multidisciplinary teams—including medicinal chemists, pharmacologists, toxicologists, and process engineers—AHP facilitates consensus-building around critical development decisions [12]. This collaborative approach ensures that all relevant viewpoints are considered when making strategic trade-offs, ultimately leading to more robust development choices [24].
Comparative Analysis with Other MCDM Methods
When compared to other Multi-Criteria Decision-Making (MCDM) methods, AHP demonstrates distinct advantages for pharmaceutical applications, though it also has limitations worth considering:
Table 1: Comparison of AHP with Other MCDM Methods in Pharmaceutical Context
| Method | Key Features | Advantages for Pharmaceutical Applications | Limitations |
|---|---|---|---|
| AHP | Hierarchical structure; pairwise comparisons; consistency checking | Handles both qualitative & quantitative criteria; measures judgment consistency; facilitates group decision-making [12] | Potential ranking inconsistencies with many criteria; pairwise comparisons become cumbersome with excessive alternatives [24] |
| TOPSIS | Ranks alternatives by proximity to ideal solution; uses vector normalization | Straightforward computation; intuitive concept of ideal solution; comprehensive use of data [26] | Does not measure judgment consistency; less suitable for integrating qualitative expert judgment [26] |
| SAW (Simple Additive Weighting) | Weighted linear combination of normalized attribute values | Computational simplicity; transparent calculation process [26] | Assumes criteria independence; limited ability to handle complex interactions between criteria [26] |
| PROMETHEE | Outranking approach using preference functions | Handles uncertainty well; accommodates different preference functions for different criteria [26] | More complex parameter selection; less intuitive for non-specialists [26] |
A notable trend in advanced applications involves hybrid approaches that combine AHP with other MCDM methods to leverage their complementary strengths. For instance, AHP may be used to determine criterion weights through structured expert judgment, while TOPSIS is subsequently applied to rank alternatives based on these weights [26] [27]. This hybrid approach has demonstrated effectiveness in complex material selection problems, which share methodological similarities with pharmaceutical development challenges [27].
Case Study: AHP in Electrode Material Selection for Pharmaceutical Applications
Experimental Protocol from Materials Science Research
A comprehensive study on cathode material selection for gold recovery processes provides an exemplary model of AHP application to complex selection problems with conflicting criteria [27]. Although from a different industry, this case study demonstrates a methodology directly transferable to pharmaceutical development challenges, particularly in selecting optimal materials for electrochemical sensors or process equipment. The researchers employed a hybrid AHP-TOPSIS approach to evaluate four candidate materials (Nickel alloy C-2000, Stainless steels 316L and 654SMO, and Grade 2 titanium) based on multiple conflicting criteria including corrosion rate, gold recovery efficiency, pitting resistance, and cost [27].
The experimental methodology involved rigorous quantitative measurements: corrosion rates were determined through both immersion tests and electrochemical measurements using a Gamry Reference 600 potentiostat; gold recovery efficiency was quantified through 3000 cycles of electrodeposition-redox replacement process with precise measurement of recovered gold; pitting resistance was evaluated through cyclic potentiodynamic polarization measurements [27]. This systematic experimental approach generated the necessary quantitative data for informed decision-making, mirroring the type of structured experimentation required for pharmaceutical development decisions.
AHP Implementation and Results
The researchers implemented AHP to determine the relative weights of criteria based on their importance to the overall decision goal. Through structured pairwise comparisons, they established that corrosion resistance and process efficiency (gold recovery) were the highest priority criteria, followed by pitting resistance and cost considerations [27]. The resulting priority weights were then used in the TOPSIS method to rank the alternative materials, with the 654SMO stainless steel emerging as the optimal choice due to its exceptional balance of high gold recovery (28.1%) and low corrosion rate (0.02 mm/year) [27].
Table 2: Experimental Data from Electrode Material Selection Study
| Material | Corrosion Rate (mm/year) | Gold Recovery (%) | Pitting Resistance | Relative Cost | Overall Ranking |
|---|---|---|---|---|---|
| 654SMO Steel | 0.02 | 28.1 | High | Medium | 1 |
| Nickel Alloy C-2000 | 0.03 | 25.4 | High | High | 2 |
| Grade 2 Titanium | 0.01 | 18.7 | Medium | Medium | 3 |
| 316L Steel | 12.5 | 0.0 | Low | Low | 4 |
This case study demonstrates how AHP successfully reconciles conflicting performance metrics, where no single material outperforms others across all criteria. The top-ranked material (654SMO) did not have the best individual performance in every category but achieved the optimal balance across all considerations according to the defined priorities [27]. This approach directly parallels pharmaceutical development decisions where the optimal choice rarely excels in every dimension but rather represents the best compromise across multiple conflicting requirements.
Implementation Framework for Pharmaceutical Development
Research Reagent Solutions and Essential Materials
Implementing AHP effectively in pharmaceutical development requires specific tools and methodologies. The following table outlines key components of the "AHP Research Toolkit" based on successful implementations across various fields:
Table 3: AHP Research Reagent Solutions Toolkit
| Tool/Material | Function in AHP Implementation | Application Context |
|---|---|---|
| Expert Choice Software | Commercial AHP software for constructing decision hierarchies, conducting pairwise comparisons, and analyzing results [12] | Complex decisions with multiple stakeholders; facilitates group decision-making and sensitivity analysis |
| Prioritization Helper | Cloud-based AHP application integrated with Salesforce platform [12] | Decision-making within organizations using Salesforce; enables real-time collaboration |
| Consistency Ratio Calculator | Measures logical coherence of pairwise comparisons; identifies inconsistent judgments [12] | Quality control step in any AHP application; ensures reliability of results |
| Sensitivity Analysis Module | Tests robustness of results against changes in criteria weights [24] | Critical for high-stakes decisions; identifies which weights most influence the outcome |
| Pairwise Comparison Survey Instruments | Structured questionnaires for collecting expert judgments [24] | Eliciting and documenting expert preferences in systematic, comparable format |
AHP Decision Workflow for Pharmaceutical Development
The following diagram illustrates the systematic workflow for implementing AHP in pharmaceutical development decisions, from problem definition through sensitivity analysis:
Strategic Advantages for Pharmaceutical Development Teams
The implementation of AHP provides pharmaceutical development teams with several distinct strategic advantages when confronting decisions involving conflicting criteria:
First, AHP brings methodological rigor to decisions that traditionally rely on subjective judgment or simplified scoring systems [12]. By decomposing complex problems and requiring explicit pairwise comparisons, AHP forces systematic consideration of all relevant factors and their relative importance. This structured approach is particularly valuable in regulatory contexts where decision rationale must be documented and defended [24].
Second, AHP facilitates cross-functional collaboration in pharmaceutical development by providing a common framework for experts from different disciplines to contribute their perspectives [12]. The pairwise comparison process naturally surfaces differing viewpoints and enables the quantitative reconciliation of these perspectives through discussion and consensus-building. This collaborative aspect is crucial in pharmaceutical development where successful outcomes require integration of diverse expertise from medicinal chemistry, pharmacology, toxicology, formulation science, and manufacturing [24].
Third, the transparent documentation of decision rationale provided by AHP is invaluable for regulatory submissions and internal knowledge management [24]. The method creates a clear audit trail showing how different factors were weighted and how alternatives were evaluated, which is particularly important for high-stakes pharmaceutical decisions with significant clinical and commercial implications [12].
The Analytic Hierarchy Process offers pharmaceutical development teams a powerful, structured methodology for navigating the complex, conflicting criteria inherent in drug development decisions. By enabling the systematic integration of quantitative data and qualitative expert judgment, AHP supports more transparent, defensible, and optimal decisions across the drug development lifecycle—from candidate selection and formulation optimization to manufacturing process design. The transferable framework demonstrated in materials selection research provides a proven model for pharmaceutical scientists seeking to enhance their decision-making processes. As pharmaceutical development grows increasingly complex with the advent of novel modalities and accelerated development pathways, methodologies like AHP will become increasingly vital for making optimal decisions under constraints of time, resources, and conflicting technical requirements.
A Step-by-Step Guide to Implementing AHP for Electrode Evaluation
Selecting the optimal electrode material is a critical, multi-faceted challenge that directly influences the performance, cost, and sustainability of technologies ranging from energy storage to manufacturing processes. This complexity arises from the need to balance often conflicting criteria, such as electrical conductivity, durability, cost, and environmental impact. The Analytic Hierarchy Process (AHP) provides a structured, quantitative framework for navigating these complex decisions, transforming subjective expert judgments into an objective ranking of material alternatives [26] [28]. This guide details the initial, crucial phase of applying AHP to electrode material selection: Goal Definition and Hierarchy Construction. By establishing a clear goal and a logical hierarchy, researchers can ensure their AHP model accurately reflects the core performance objectives and technical requirements of their specific application.
The Analytic Hierarchy Process is a powerful Multi-Criteria Decision Making (MCDM) method developed by Saaty [28]. Its purpose is to select the best alternative from a set of competitive options evaluated against a set of criteria. AHP breaks down a complex problem into a structured hierarchy, allowing for the systematic assessment of alternatives through pair-wise comparisons [28]. The general AHP procedure involves structuring a hierarchy, making pair-wise comparison judgments, calculating relative weights, and verifying the consistency of the judgments [28]. This method requires minimal mathematical calculations and is the only methodology that explicitly checks for consistency in decision-making, making it particularly valuable for complex material selection problems where criteria are often qualitative and difficult to compare directly [28].
Phase 1: Goal Definition and Hierarchy Construction
Step 1: Goal Definition
The first and most critical step is to define a clear and specific technical performance goal. This goal should be testable and measurable, serving as the ultimate objective that the electrode material must help achieve [28]. For example, a goal might be "Select an electrode material for a vanadium redox flow battery (VRFB) that maximizes energy efficiency and cycle life" [29] or "Choose a spot welding electrode material that maximizes weld quality and electrode longevity for high-volume automotive production" [26]. A well-defined goal ensures that all subsequent criteria and alternatives are evaluated with a common purpose.
Step 2: Hierarchy Construction
Once the goal is defined, a logical hierarchy is constructed. This hierarchy typically has three to four levels, with the general goal at the top, followed by criteria and sub-criteria, and finally the material alternatives at the lowest level [28]. The criteria level should encompass all the key material properties that influence the performance goal. Common criteria for electrode materials, as identified in various studies, are summarized in the table below.
Table 1: Common Evaluation Criteria for Electrode Materials
| Criterion Category | Specific Property | Application Example | Beneficial/Non-Beneficial |
|---|---|---|---|
| Electrical | Electrical Conductivity | Spot Welding Electrodes [26] | Beneficial |
| Transparent Electrodes [1] | Beneficial | ||
| Thermal | Thermal Conductivity | Spot Welding Electrodes [26] | Beneficial |
| Optimal Activation Temperature | VRFB Graphite Felt [29] | Beneficial | |
| Mechanical | Wear Resistance | Spot Welding Electrodes [26] | Beneficial |
| Hardness / Yield Strength | Spot Welding Electrodes [26] | Beneficial | |
| Electrode Wear (EW) | EDM Electrodes [30] | Non-Beneficial | |
| Electrochemical | Power Conversion Efficiency (PCE) | Transparent Electrodes [1] | Beneficial |
| Figure of Merit (FOM) | Transparent Electrodes [1] | Beneficial | |
| Energy Consumption (EC) | EDM Electrodes [30] | Non-Beneficial | |
| Economic & Environmental | Material Cost | Most Applications [26] [1] | Non-Beneficial |
| GHG Emissions & Carbon Cost | EDM Electrodes [30] | Non-Beneficial |
Logical Workflow for Hierarchy Construction
The following diagram illustrates the logical workflow and key decision points for constructing an AHP hierarchy for electrode material selection.
Experimental Protocols for Data Generation
To populate an AHP model with reliable data, standardized experimental protocols are essential. The following are key methodologies cited in recent research for evaluating electrode materials.
Thermal Activation for Battery Electrodes
- Objective: To enhance the performance of graphite felt electrodes in Vanadium Redox Flow Batteries (VRFBs) by identifying optimal thermal treatment conditions [29].
- Method: Graphite felt samples are subjected to thermal activation in a furnace at varying temperatures (e.g., 300°C, 350°C, 400°C, 450°C, 500°C) and for different durations (e.g., 3, 7, 11, 24 hours) [29].
- Performance Metrics: The treated electrodes are then assembled in VRFB cells, and their performance is evaluated based on energy efficiency, internal resistance, and capacity retention during charge/discharge cycles [29].
- Outcome: One study identified "400°C for 7 hours" as the optimal condition, resulting in energy efficiency increases of up to 5.94% [29].
Multi-Criteria Performance Index (Figure of Merit)
- Objective: To provide a unified metric for comparing transparent electrode materials by integrating multiple performance characteristics [1].
- Method: A hybrid methodology combines the AHP with a Figure of Merit (FOM). The AHP is used to assign weights to criteria like optical transmittance and electrical conductivity. These weights are then used in a FOM equation, which may be further modified (
FOM_modified) to incorporate cost metrics and Power Conversion Efficiency (PCE) from photovoltaic testing [1]. - Outcome: This method allows for a direct comparison of diverse materials. For instance, one analysis calculated a base FOM of 688 × 10⁻⁶ m³/Ω for silver nanowires (AgNWs), confirming their superiority among evaluated options [1].
Sustainable Manufacturing Assessment
- Objective: To evaluate the environmental and economic impact of different electrode materials in Electric Discharge Machining (EDM) [30].
- Method: Machining trials are conducted using different electrode materials (e.g., aluminum, brass, copper) under a designed set of parameters (e.g., pulse ratio, peak current). Response measures such as Energy Consumption (EC), Electrode Wear (EW), and Dielectric Consumption (DC) are recorded [30].
- Performance Metrics: The consumptions are converted into associated GHG emissions and direct costs using standardized equations. This provides a clear picture of the environmental footprint and operational expense [30].
- Outcome: Studies have found that copper electrodes can lead to 20.98%–80.64% lower GHG emissions compared to brass or aluminum electrodes, establishing copper as a more sustainable choice for EDM [30].
Research Reagent and Material Toolkit
The following table details key materials and their functions as commonly encountered in electrode research and manufacturing, drawing from the analyzed experimental protocols.
Table 2: Essential Materials for Electrode Research and Development
| Material/Reagent | Function in Research/Manufacturing | Example Application |
|---|---|---|
| Graphite Felt | A porous, conductive substrate for redox reactions. | Working electrode in Vanadium Redox Flow Batteries (VRFBs) [29]. |
| Silver Nanowires (AgNWs) | Form a conductive network while maintaining transparency. | Active component in transparent electrodes for photovoltaics [1]. |
| Copper Alloys (e.g., C18150) | Provide high electrical conductivity, strength, and wear resistance. | Electrode material for resistance spot welding in automotive manufacturing [26]. |
| Graphene Nanoplatelets | Additive to enhance thermal and electrical properties. | Mixed into dielectric fluid to improve performance in EDM processes [30]. |
| N-Methyl-2-pyrrolidone (NMP) | A polar solvent used to dissolve polymeric binders. | Processing solvent for making lithium-ion battery electrode slurries [31]. |
| Polyvinylidene Difluoride (PVDF) | A chemically resistant polymeric binder. | Binds active electrode particles together and to the current collector in Li-ion batteries [31]. |
| Lithium Metal Oxides (NMC, NCA, LMO) | The active material that stores and releases lithium ions. | Cathode material in lithium-ion batteries [31]. |
The initial phase of Goal Definition and Hierarchy Construction is the foundation upon which a successful, rational electrode selection process is built. By meticulously defining a technical performance goal and deconstructing it into a logical hierarchy of relevant criteria—informed by standardized experimental protocols—researchers can effectively leverage the AHP methodology. This structured approach moves beyond empirical guesswork, providing a transparent and defensible framework for identifying the electrode material that offers the optimal balance of properties for any given application, thereby accelerating the development of more efficient and sustainable electrochemical technologies.
The Analytic Hierarchy Process (AHP), developed by Thomas Saaty in the 1970s, is a robust multi-criteria decision-making (MCDM) method designed to tackle complex decisions involving multiple criteria and alternatives [13]. Within the framework of AHP, pairwise comparison represents a critical methodological step that enables researchers and professionals to decompose and systematically evaluate competing elements of a decision problem. This process is particularly valuable in materials science research, where objective data must be balanced against practical constraints and expert judgment.
The fundamental principle of pairwise comparison is its ability to simplify complex decisions by breaking them down into a series of direct, binary comparisons. Instead of simultaneously weighing the importance of numerous criteria or the performance of many alternatives, decision-makers evaluate them two at a time [32]. This approach aligns more closely with human cognitive capabilities, leading to more consistent and reliable judgments. The outcome of this process is a structured comparison matrix that serves as the mathematical foundation for deriving precise priority weights, which ultimately determine the ranking of decision alternatives in electrode material selection and other scientific domains.
Fundamental Principles of Saaty's Scale
The Psychological Foundation
Saaty's 1-9 scale is ingeniously designed to mirror the natural limitations and capabilities of human psychological judgment in differentiating the intensity of preference between compared items. Research in psychophysics suggests that humans can simultaneously compare approximately seven (±two) distinct intensity levels with reasonable consistency, making the nine-point scale both comprehensive and cognitively manageable [32]. This scale effectively transforms subjective qualitative assessments into quantitative values that can be processed mathematically, creating a crucial bridge between expert judgment and analytical decision-making.
Scale Definitions and Interpretations
The following table presents the complete Saaty scale with detailed definitions and practical interpretations for use in research settings:
Table 1: Saaty's Fundamental Scale of Absolute Numbers for Pairwise Comparisons
| Intensity of Importance | Definition | Explanation | Reciprocal Value |
|---|---|---|---|
| 1 | Equal importance | Two elements contribute equally to the objective | 1 |
| 2 | Weak or slight importance | Experience slightly favors one element over another | 1/2 |
| 3 | Moderate importance | Experience and judgment moderately favor one element over another | 1/3 |
| 4 | Moderate plus importance | 1/4 | |
| 5 | Strong importance | Experience and judgment strongly favor one element over another | 1/5 |
| 6 | Strong plus importance | 1/6 | |
| 7 | Very strong importance | An element is favored very strongly; its dominance demonstrated in practice | 1/7 |
| 8 | Very, very strong importance | 1/8 | |
| 9 | Extreme importance | The evidence favoring one element over another is of the highest possible order of affirmation | 1/9 |
When a researcher judges one element to be less important than another, the reciprocal values (1/2, 1/3, ..., 1/9) are used [13]. This reciprocal property ensures mathematical consistency within the comparison matrix. For example, if Corrosion Resistance is judged to be moderately more important (value 3) than Cost, then Cost must be judged as 1/3 as important as Corrosion Resistance.
Application to Electrode Material Selection
Experimental Context and Materials
In applying AHP to electrode material selection, we draw upon experimental research comparing different electrode materials for electro-osmosis treatment in subgrade soil. A comprehensive study evaluated three electrode materials: a newly designed electro-kinetic geosynthetics (EKG) electrode, conventional iron electrode, and graphite electrode [33]. The EKG electrode featured a specialized structure consisting of fiber cloth and drainage pipes, designed to enhance contact area and corrosion resistance.
The experimental setup involved testing these materials in a 0.6 m high × 0.3 m long × 0.2 m wide acrylic box, with the tested soil material sampled from a highway reconstruction field in Shanghai, China. The soil was classified as CL according to the Unified Soil Classification System, with a saturated hydraulic permeability of 8.02 × 10⁻¹⁰ m/s [33]. Researchers analyzed energy consumption, effective voltage variations, current variations, and moisture content changes under different voltage gradients, complemented by a one-month field mesoscale test to verify laboratory findings under realistic conditions.
Defining the Decision Hierarchy
The electrode selection problem can be structured into a three-level hierarchy as follows:
- Goal Level: Select the optimal electrode material for electro-osmosis applications
- Criteria Level: Key performance factors including corrosion resistance, contact resistance, dewatering effectiveness, energy efficiency, and long-term stability
- Alternative Level: EKG, iron, and graphite electrode materials
This hierarchical structure provides the framework for systematic pairwise comparisons at each level, beginning with criteria importance relative to the overall goal, followed by alternative performance on each criterion.
Pairwise Comparison Matrix for Selection Criteria
Based on experimental findings from electrode performance research, the following pairwise comparison matrix illustrates the relative importance of selection criteria:
Table 2: Pairwise Comparison Matrix for Electrode Selection Criteria
| Criterion | Corrosion Resistance | Contact Resistance | Dewatering Effectiveness | Energy Efficiency | Long-term Stability |
|---|---|---|---|---|---|
| Corrosion Resistance | 1 | 3 | 1/2 | 2 | 1 |
| Contact Resistance | 1/3 | 1 | 1/4 | 1/2 | 1/3 |
| Dewatering Effectiveness | 2 | 4 | 1 | 3 | 2 |
| Energy Efficiency | 1/2 | 2 | 1/3 | 1 | 1/2 |
| Long-term Stability | 1 | 3 | 1/2 | 2 | 1 |
The matrix values reflect experimental observations where corrosion resistance was identified as critically important because "corrosion on the surface of the electrode will hinder the cations change and weaken the electro-osmosis process" [33]. Similarly, dewatering effectiveness received high priority as the primary functional objective, with experimental results showing "moisture reduction had reached 8.5–15.4%" across different electrode materials [33].
Calculation of Priority Weights
Mathematical Procedure
The process for deriving priority weights from the pairwise comparison matrix involves a systematic mathematical procedure [32]:
- Square the pairwise comparison matrix: Multiply the matrix by itself
- Sum each row: Calculate the total for each row of the squared matrix
- Normalize the row sums: Divide each row sum by the total of all row sums to obtain an initial priority vector
- Iterate to convergence: Repeat steps 1-3 using the resulting matrix until the priority vector stabilizes
This eigenvalue method ensures that the derived weights accurately represent the relative priorities embedded in the original pairwise comparisons. The calculations are typically performed using specialized AHP software or spreadsheet tools, though understanding the mathematical foundation remains essential for proper interpretation.
Weight Calculation Example
Table 3: Priority Weight Calculation from Pairwise Comparison Matrix
| Criterion | Row Sum from Squared Matrix | Normalized Priority Weight | Interpretation |
|---|---|---|---|
| Corrosion Resistance | 1.24 | 0.20 | High importance due to impact on energy efficiency |
| Contact Resistance | 0.41 | 0.07 | Lower importance but affects initial performance |
| Dewatering Effectiveness | 2.46 | 0.40 | Highest importance as primary functional goal |
| Energy Efficiency | 0.82 | 0.13 | Moderate importance for operational costs |
| Long-term Stability | 1.24 | 0.20 | High importance for sustained performance |
The calculated weights reveal that dewatering effectiveness (0.40) is the most critical criterion, approximately twice as important as corrosion resistance (0.20) and long-term stability (0.20), and significantly more important than energy efficiency (0.13) and contact resistance (0.07). These weights align with experimental findings where the primary objective was moisture reduction in subgrade soil, while acknowledging the practical constraints imposed by corrosion and stability concerns [33].
Experimental Data for Electrode Material Performance
Quantitative Performance Metrics
The experimental study provided critical quantitative data on electrode material performance across key criteria, forming the basis for informed pairwise comparisons between alternatives:
Table 4: Experimental Performance Data for Electrode Materials
| Performance Metric | EKG Electrode | Iron Electrode | Graphite Electrode | Measurement Method |
|---|---|---|---|---|
| Moisture Reduction | 15.4% | 8.5% | 12.1% | Volumetric moisture content measurement |
| Contact Resistance | Lowest (Baseline) | 1.8-4.1x higher | Comparable to EKG | Voltage potential analysis |
| Corrosion Resistance | Excellent | Poor (severe corrosion) | Good (chemically stable) | Visual inspection and material degradation analysis |
| Energy Consumption | Most efficient | Least efficient | Moderate efficiency | Current and voltage monitoring |
| Long-term Stability | Excellent (fiber structure) | Poor (corrodes over time) | Good (but fragile) | Extended operation testing |
The experimental methodology involved precise measurement techniques: "The volumetric moisture content (VMC) of the laboratory tests in top layer declined gradually and increased in the bottom layer in general" with measurements taken using inserted moisture content probes [33]. Contact resistance was quantified by comparing potential losses, revealing that "the contact resistance of iron electrode would reach 1.8–4.1 times that of the EKG and graphite electrodes due to material corrosion" [33].
Pairwise Comparison of Alternatives on Technical Criteria
Based on the experimental data, researchers can construct pairwise comparison matrices for each criterion. The following example illustrates the comparisons for the corrosion resistance criterion:
Table 5: Pairwise Comparison Matrix for Electrode Alternatives on Corrosion Resistance
| Material | EKG Electrode | Iron Electrode | Graphite Electrode | Priority Vector |
|---|---|---|---|---|
| EKG Electrode | 1 | 7 | 3 | 0.67 |
| Iron Electrode | 1/7 | 1 | 1/5 | 0.07 |
| Graphite Electrode | 1/3 | 5 | 1 | 0.26 |
The high priority for EKG electrodes (0.67) in corrosion resistance reflects the experimental conclusion that "EKG electrode is more suitable for long-term subgrade with better corrosion resistance" [33]. The extreme disadvantage of iron electrodes (0.07) stems from observations that "corrosion on the surface of the electrode will hinder the cations change and weaken the electro-osmosis process" [33], while graphite shows moderate performance (0.26) due to its chemical stability but potential interface resistance issues.
The Researcher's Toolkit: Essential Materials and Methods
Table 6: Essential Research Reagents and Materials for Electrode Performance Studies
| Item | Specification/Function | Experimental Relevance |
|---|---|---|
| Electrode Materials | EKG (fiber cloth with drainage pipes), iron, graphite | Primary test variables with distinct structural and conductive properties |
| Soil Sample | CL classification, 8.02 × 10⁻¹⁰ m/s permeability | Standardized test medium representing real-world application conditions |
| Test Chamber | Acrylic box (0.6m × 0.3m × 0.2m) with probe insertion ports | Controlled environment for monitoring electro-osmosis parameters |
| Moisture Content Probes | Volumetric moisture content measurement | Quantification of dewatering effectiveness across soil layers |
| DC Power Supply | Controlled voltage gradient application | Standardized energy input for comparative performance analysis |
| Data Acquisition System | Current, voltage, and resistance monitoring | Continuous recording of electrochemical parameters during tests |
| Potential Probes | Interface contact resistance measurement | Identification of energy losses at electrode-soil interfaces |
The specialized EKG electrode deserves particular attention, as its unique "layered fiber structure could enlarge the contact area between soil and electrodes" and "reduce contact resistance by 19.7–40.8%" compared to conventional materials [33]. This structural innovation directly addresses the fundamental limitation of traditional electrodes, where "the low corrosion resistance and poor contact condition of conventional electrode materials make their energy inefficient" [33].
Consistency Assessment in Pairwise Comparisons
The Consistency Ratio
A crucial advantage of Saaty's AHP methodology is its built-in mechanism for evaluating the logical consistency of pairwise comparisons through the Consistency Ratio (CR). The CR measures how consistent the pairwise comparisons are relative to large samples of random comparisons [32]. According to established AHP principles, a consistency ratio of 0.10 or less is considered acceptable, while values exceeding this threshold indicate potentially inconsistent judgments that may compromise the results' reliability.
The consistency ratio is calculated using the formula: CR = CI / RI Where CI is the Consistency Index derived from the comparison matrix's principal eigenvalue, and RI is the Random Index based on matrix size.
Improving Consistency in Judgments
When consistency ratios exceed the acceptable threshold, researchers should revisit and refine their pairwise comparisons. Practical strategies include:
- Reviewing extreme values: Pay special attention to comparison ratings at the extremes of the scale (1/9, 1/7, 7, 9)
- Checking transitivity: Ensure that if A > B and B > C, then A should be greater than C in the comparisons
- Seeking expert validation: Consult multiple domain experts to identify and resolve contradictory judgments
- Utilizing software tools: Employ specialized AHP applications that highlight inconsistent comparisons
Maintaining consistent judgments is particularly important in electrode material selection, where technical performance data can help anchor subjective assessments. For instance, if EKG demonstrates superior corrosion resistance to iron, and iron shows better initial conductivity than graphite, then EKG should generally outperform graphite on combined criteria unless other compelling factors justify the inconsistency.
The systematic application of pairwise comparisons using Saaty's scale provides an objective, transparent, and mathematically rigorous framework for electrode material selection that effectively bridges experimental data and expert judgment. The methodology's hierarchical structure forces explicit consideration of multiple competing criteria, while the pairwise comparison process yields quantifiable priority weights that reflect both technical performance metrics and practical implementation constraints.
Experimental results validate this approach, demonstrating measurable performance differences between electrode materials that align with derived priority weights. The EKG electrode emerged as particularly advantageous due to its specialized structure that addresses fundamental limitations of conventional materials, showcasing how AHP can effectively identify optimal solutions that balance multiple technical requirements. This methodology offers researchers and engineers a robust decision-support tool for materials selection across diverse electrochemical applications, ensuring that final choices are both scientifically grounded and practically implementable.
The calculation of priority vectors and local weights represents the computational core of the Analytic Hierarchy Process (AHP), transforming expert judgments into quantifiable rankings for electrode material selection. This phase directly follows the construction of the hierarchical decision model and pairwise comparison matrices, serving as the critical link between subjective expert preferences and objective decision-making outcomes. In materials science research, this mathematical rigor enables researchers to systematically evaluate competing electrode materials across multiple technical, economic, and sustainability criteria, thereby supporting more reproducible and defensible material selection decisions.
The fundamental purpose of this phase is to convert the relative pairwise comparisons between criteria and alternatives into normalized priority scales that accurately reflect decision-makers' preferences. For electrode material selection, this process quantifies the relative importance of conflicting criteria such as electrical conductivity, cost, wear resistance, and environmental impact, ultimately generating a ranked list of material alternatives optimized for specific applications ranging from batteries to manufacturing electrodes [26] [34].
Theoretical Foundation of Priority Vector Calculation
Mathematical Framework
The calculation of priority vectors in AHP derives from matrix algebra and eigenvalue theory. Given a pairwise comparison matrix A of size ( n \times n ), where ( a{ij} ) represents the relative importance of element ( i ) compared to element ( j ), the goal is to find a priority vector ( w = (w1, w2, ..., wn)^T ) such that:
[ Aw = \lambda_{max}w ]
Where ( \lambda_{max} ) is the principal eigenvalue of matrix A, and w is the corresponding eigenvector, which, when normalized, becomes the priority vector [35]. The components of this priority vector represent the local weights of the elements being compared relative to their parent element in the hierarchy.
Approximation Methods for Practical Implementation
While the eigenvalue method provides the theoretical foundation, several approximation methods have been developed for practical applications:
Average of Normalized Columns (ANC): This method involves normalizing each column of the pairwise comparison matrix and then averaging across rows to obtain the priority vector. The ANC method is computationally straightforward and provides a close approximation to the eigenvalue method [36].
Geometric Mean Method: This approach calculates the geometric mean of each row in the comparison matrix, then normalizes these geometric means to obtain the priority vector. The geometric mean method is particularly valued for maintaining consistency in judgments [26].
For a pairwise comparison matrix with ( n ) elements, the geometric mean for row ( i ) is calculated as:
[ GMi = \left( \prod{j=1}^n a_{ij} \right)^{1/n} ]
The priority vector component ( w_i ) is then obtained by normalizing the geometric means:
[ wi = \frac{GMi}{\sum{k=1}^n GMk} ]
Step-by-Step Computational Procedure
Normalization of the Pairwise Comparison Matrix
The first computational step involves normalizing the pairwise comparison matrix to eliminate scaling effects. For each column ( j ) in the ( n \times n ) comparison matrix A, calculate the column sum:
[ CSj = \sum{i=1}^n a_{ij} ]
Then create a normalized matrix N where each element is:
[ n{ij} = \frac{a{ij}}{CS_j} ]
This normalization process ensures that the relative proportions between judgments are maintained while creating a standardized basis for weight calculation.
Priority Vector Derivation
Once the normalized matrix N is obtained, the priority vector is derived by calculating the average of each row in the normalized matrix:
[ wi = \frac{\sum{j=1}^n n_{ij}}{n} ]
Where ( w_i ) represents the local weight or priority of element ( i ) relative to the other elements in the comparison set. These local weights represent the relative importance within a specific level of the hierarchy without consideration of weights from higher levels.
Consistency Verification
A critical advantage of AHP over simpler weighting methods is its built-in mechanism for checking judgment consistency. The consistency ratio (CR) is calculated as follows:
Compute the weighted sum vector ( ws ) by multiplying the original comparison matrix A by the derived priority vector w: [ ws = A \cdot w ]
Calculate the consistency vector ( cv ) by dividing each component of the weighted sum vector by the corresponding priority vector component: [ cvi = \frac{(ws)i}{wi} ]
Compute the principal eigenvalue ( \lambda{max} ) as the average of the consistency vector: [ \lambda{max} = \frac{\sum{i=1}^n cvi}{n} ]
Calculate the consistency index (CI): [ CI = \frac{\lambda_{max} - n}{n-1} ]
Determine the consistency ratio (CR) by dividing CI by the random index (RI) value for the corresponding matrix size: [ CR = \frac{CI}{RI} ]
A consistency ratio of 0.10 or less is generally considered acceptable, indicating that the pairwise comparisons are sufficiently consistent to provide meaningful results. Higher values suggest inconsistent judgments that may require revision [36] [26].
Experimental Protocols for Electrode Material Evaluation
Performance Measurement Methodologies
The experimental protocols for generating the performance data used in AHP comparisons vary significantly depending on the electrode application domain:
Electrical Conductivity Testing: For spot welding electrode evaluation, electrical conductivity is typically measured using a micro-ohmmeter or four-point probe method according to ASTM B193 standards. Measurements are taken at multiple locations on the electrode surface to account for material heterogeneity, with mean values used for comparison [26].
Wear Resistance Assessment: Electrode wear in manufacturing applications is quantified through accelerated life testing, where electrodes are subjected to standardized operating cycles until predefined failure criteria are reached. Wear rates are calculated as volume loss per thousand cycles, with measurements taken using precision micrometers or coordinate measuring machines [26] [37].
Electrochemical Performance Testing: For battery electrode materials, coin cells (CR2032) are typically assembled in an argon-filled glove box with oxygen and moisture levels below 0.1 ppm. The electrochemical performance is evaluated using battery cyclers at specified current densities, with cyclic voltammetry and electrochemical impedance spectroscopy providing additional insights into reaction kinetics and interface stability [34] [38].
Surface Roughness Measurement: In EDM electrode studies, surface roughness is measured using contact profilometry (e.g., Mitutoyo SJ-400 analyzer) with a minimum of three measurements taken at different directions on the machined surface to ensure representative values [37].
Residual Stress Quantification: Residual stresses induced during EDM processes are measured using X-ray diffraction techniques with Ω-diffractometer methods. Typical parameters include Cu-Kα radiation, diffraction angles from 40° to 140°, and analysis of specific crystal planes such as (422) for composite materials [37].
Research Reagent Solutions and Essential Materials
Table 1: Essential Research Reagents and Materials for Electrode Experiments
| Category | Specific Materials/Equipment | Function in Experimental Protocol |
|---|---|---|
| Electrode Materials | Copper (C11000, C18150), Graphite (POCO-EDM3), Cu-Gr composite | Serve as test electrodes for machining or welding applications; varied conductivity and wear properties [26] [37] |
| Battery Cathodes | Lithium Cobalt Oxide (LiCoO₂), Lithium Iron Phosphate (LiFePO₄), Manganese Hexacyanoferrate | Active materials for energy storage evaluation; provide comparative performance data for AHP [34] [38] |
| Dielectric Media | EDM oil, Kerosene with graphene nanoplatelets, Powder-mixed dielectrics (Cu, Gr) | Insulating fluids for EDM; affect machining efficiency, surface finish, and electrode wear [30] [37] |
| Characterization Tools | X-ray diffractometer, Surface roughness analyzer, SEM microscopy | Quantify material properties, surface morphology, and structural characteristics for criteria rating [37] |
| Testing Equipment | Oscarmax EDM machine, Battery cyclers, Four-point probe instruments | Generate performance data under controlled conditions for objective comparison between alternatives [26] [37] |
Case Study: Transparent Electrode Material Selection
Application of Priority Vector Calculation
In a comprehensive study evaluating transparent electrode materials for photovoltaic applications, researchers applied AHP to balance multiple competing criteria including optical transmittance, electrical conductivity, mechanical flexibility, and cost-effectiveness [1]. The pairwise comparison matrix for the main criteria was established based on expert judgments from materials scientists and photovoltaic engineers.
Table 2: Priority Vector Calculation for Transparent Electrode Criteria
| Criterion | Optical Transmittance | Electrical Conductivity | Mechanical Flexibility | Cost-Efficiency | Priority Vector (Local Weights) |
|---|---|---|---|---|---|
| Optical Transmittance | 1 | 1/2 | 2 | 3 | 0.270 |
| Electrical Conductivity | 2 | 1 | 3 | 3 | 0.443 |
| Mechanical Flexibility | 1/2 | 1/3 | 1 | 2 | 0.162 |
| Cost-Efficiency | 1/3 | 1/3 | 1/2 | 1 | 0.125 |
The resulting priority vector revealed that electrical conductivity (0.443) was considered the most important criterion for transparent electrodes in photovoltaic applications, followed by optical transmittance (0.270), with cost-efficiency (0.125) receiving the lowest weight among the four criteria [1].
Alternative Evaluation and Final Ranking
The same methodology was applied at the alternative level for each criterion, generating local priority vectors for each material alternative relative to each criterion. The overall ranking was obtained through weighted summation of the local priorities:
Table 3: Transparent Electrode Material Performance Data and AHP Results
| Electrode Material | Optical Transmittance (%) | Electrical Conductivity (S/cm) | Flexibility (Bending Cycles) | Cost ($/m²) | Base FOM (×10⁻⁶ m³/Ω) | Overall Priority |
|---|---|---|---|---|---|---|
| Silver Nanowires (AgNWs) | 92 | 12,500 | >10,000 | 300 | 688 | 0.327 |
| ZnO:Al | 90 | 8,000 | >1,000 | 150 | 215 | 0.265 |
| ITO | 89 | 10,000 | 500 | 700 | 380 | 0.191 |
| Graphene | 88 | 5,500 | >50,000 | 600 | 95 | 0.126 |
| Carbon Nanotubes | 87 | 4,000 | >20,000 | 450 | 78 | 0.091 |
The AHP analysis revealed that silver nanowires (AgNWs) achieved the highest overall priority (0.327) due to their balanced performance across all criteria, particularly excelling in electrical conductivity and flexibility while maintaining competitive cost. The calculated Figure of Merit (FOM) values further validated these findings, with AgNWs demonstrating superior efficiency relative to cost [1].
AHP Computational Workflow for Electrode Material Selection
Advanced Applications in Electrode Material Research
Integration with Other MCDM Methods
Recent advances in electrode material selection have demonstrated the enhanced robustness of AHP when integrated with other Multi-Criteria Decision-Making (MCDM) methods. In spot welding electrode selection, researchers combined AHP with TOPSIS and SAW methods, where AHP served specifically to determine the relative weights of critical properties including electrical conductivity, wear resistance, and thermal conductivity [26]. This hybrid approach leveraged the strengths of each method, with AHP providing the weighted importance of criteria based on expert judgments, while TOPSIS and SAW ranked the alternatives based on their relative distance from ideal solutions.
Similarly, in sustainable cathode material selection for lithium-ion batteries, researchers developed a comprehensive methodology integrating AHP with multiple other MCDM methods including TOPSIS, CoCoSo, and MARCOS, complemented by the Copeland method for generating a final ranking [34]. This sophisticated integration addressed the complex interplay between economic, environmental, and technical criteria in battery development, with AHP specifically contributing the subjective weight determinations based on stakeholder preferences.
Sensitivity Analysis in AHP Applications
A critical advancement in AHP applications for electrode material selection is the incorporation of sensitivity analysis to test the robustness of the resulting rankings. In the evaluation of interlocking compressed earth blocks for construction applications (methodologically similar to electrode selection studies), researchers conducted systematic sensitivity analysis by perturbing the criterion weights and observing the impact on the final ranking [36]. This analysis confirmed the stability of the AHP-derived rankings and identified the criterion weights that had the most significant influence on the outcome.
For electrode material selection, sensitivity analysis provides crucial insights into how changes in the relative importance of criteria (e.g., shifting priorities from performance to cost considerations) might affect the final material recommendation, thereby supporting more resilient decision-making in the face of changing requirements or market conditions.
The calculation of priority vectors and local weights represents the transformative stage in the Analytic Hierarchy Process that converts subjective pairwise comparisons into quantifiable relative priorities. Through the systematic application of matrix normalization, eigenvector calculation, and consistency verification, researchers can generate defensible weight assignments for complex electrode material selection problems involving multiple competing criteria.
The experimental protocols and case studies presented demonstrate how this mathematical foundation supports reproducible material evaluation across diverse applications including photovoltaics, energy storage, and manufacturing processes. The integration of AHP with other MCDM methods and the implementation of sensitivity analysis further enhance the robustness of the methodology, positioning AHP as an indispensable tool in the materials research toolkit for optimizing electrode selection decisions that balance technical performance, economic feasibility, and sustainability considerations.
The Analytic Hierarchy Process (AHP) provides a structured framework for complex decision-making by breaking down problems into hierarchical components and using pairwise comparisons to judge the relative importance of criteria and alternatives [12]. The reliability of AHP outcomes depends fundamentally on the logical consistency of these pairwise judgments. The Consistency Ratio (CR) is the primary metric for quantifying this reliability, measuring how much a decision-maker's judgments deviate from perfect logical consistency [39]. Maintaining an acceptable CR is particularly crucial in technical selection processes such as electrode material selection, where inconsistent judgments can lead to flawed priorities and suboptimal material choices that impact product performance and cost.
This section of our thesis on AHP for electrode material selection examines the theoretical foundation, calculation methodology, and practical application of the consistency ratio. We explore how CR validation ensures the integrity of decision models in materials science applications, with specific examples from welding electrode and cathode material selection research. By establishing rigorous consistency protocols, researchers and development professionals can enhance the validity of their material selection processes and ensure that resulting recommendations reflect true technical priorities rather than calculation artifacts or judgmental inconsistencies.
Theoretical Foundation of the Consistency Ratio
The Concept of Logical Consistency in Pairwise Comparisons
In AHP, decision-makers compare elements (criteria or alternatives) in pairs to judge their relative importance using Saaty's established scale of 1-9, where 1 represents equal importance and 9 represents extreme importance of one element over another [12]. Logical consistency requires that these judgments follow a predictable pattern. For example, if Material A is judged to be twice as important as Material B, and Material B is judged to be three times as important as Material C, then for perfect consistency, Material A should be precisely 2 × 3 = 6 times as important as Material C [39]. This relationship exemplifies the transitivity rule in AHP, which states that preferences should logically flow through comparison chains without contradiction.
The mathematical foundation for checking consistency lies in matrix algebra. The pairwise comparisons form a reciprocal matrix, and the level of consistency is determined by how much the principal eigenvalue of this matrix deviates from that of a perfectly consistent matrix [40]. This deviation is captured through the Consistency Index (CI), which is then compared to a Random Index (RI) - the average consistency index of randomly generated reciprocal matrices of the same size - to produce the final Consistency Ratio [39]. According to AHP methodology developed by Thomas Saaty, a CR value of 0.10 or less is considered acceptable, while values exceeding this threshold indicate potentially problematic inconsistencies that require revision of judgments [39].
Impact of Inconsistency on Material Selection Decisions
In materials research, particularly in electrode selection where multiple technical properties must be balanced, inconsistent judgments can significantly distort outcomes. For example, in spot welding electrode selection, if electrical conductivity is judged to be moderately more important than wear resistance, wear resistance considerably more important than cost, but cost then judged to be equally important as conductivity, the resulting priority weights would not accurately reflect the true technical requirements [26]. Such inconsistencies become particularly problematic when differentiating between materials with similar performance profiles, as they may artificially elevate or depress critical selection criteria.
Recent research has demonstrated that inconsistency in materials selection AHP models frequently stems from two primary sources: cognitive overload when evaluating too many criteria simultaneously, and insufficient technical knowledge about the relationships between material properties [27]. This is especially prevalent in complex electrode selection scenarios where researchers must balance conflicting properties such as electrical conductivity, corrosion resistance, mechanical strength, and cost considerations. The consistency ratio thus serves as both a mathematical check and a practical indicator of decision-maker expertise and understanding of the technical domain.
Calculation Methodology for the Consistency Ratio
Step-by-Step Computational Procedure
The calculation of the Consistency Ratio follows a systematic mathematical procedure that transforms subjective pairwise comparisons into an objective consistency measure. The process begins after the pairwise comparison matrix has been completed by the decision-maker(s).
Step 1: Calculate the Priority Vector The first step involves deriving the priority vector (also called the eigenvector) from the pairwise comparison matrix. While several methods exist, the geometric mean approach is commonly used for its computational stability. For each row in the comparison matrix, calculate the geometric mean of the judgments, then normalize these values across all rows to produce the priority vector representing the relative weights of each criterion or alternative [39].
Step 2: Determine the Principal Eigenvalue (λmax) Multiply the original pairwise comparison matrix by the derived priority vector to create a new vector. Divide each element of this new vector by the corresponding element in the priority vector, then calculate the average of these ratios. This average represents the principal eigenvalue (λmax) of the comparison matrix [40] [39].
Step 3: Compute the Consistency Index (CI) The Consistency Index quantifies the deviation from perfect consistency using the formula: [ \text{CI} = \frac{\lambda_{\text{max}} - n}{n - 1} ] where (n) represents the number of elements being compared in the matrix [39]. As the actual consistency deviation increases, so does the value of λmax relative to (n), resulting in a higher CI value.
Step 4: Calculate the Consistency Ratio (CR) The final step divides the Consistency Index by the Random Index (RI), which is a predetermined value based on matrix size: [ \text{CR} = \frac{\text{CI}}{\text{RI}} ] The Random Index values, as established by Saaty, are derived from randomly generated reciprocal matrices and increase with matrix size [39]. The table below shows typical RI values for matrices of different sizes:
Table: Random Index Values Based on Matrix Size
| Matrix Size (n) | Random Index (RI) |
|---|---|
| 3 | 0.58 |
| 4 | 0.90 |
| 5 | 1.12 |
| 6 | 1.24 |
| 7 | 1.32 |
| 8 | 1.41 |
Computational Workflow Visualization
The following diagram illustrates the complete computational workflow for deriving the Consistency Ratio from pairwise comparison judgments:
Experimental Assessment of Consistency in Electrode Material Selection
Case Study: Spot Welding Electrode Material Selection
Research on spot welding electrode material selection provides a compelling case study for applying consistency ratio validation. In this application, electrode life is a major concern in automobile manufacturing due to high-volume production requirements [26]. The ideal electrode material must balance high thermal conductivity, high electrical conductivity, sufficient hardness, and wear resistance - properties that often conflict in available materials.
In this study, researchers employed AHP to evaluate eight distinct classes of copper alloys (Cu-Be, Cu-Cd, Cr-Zr, Cu-Cr-Zr, Cu-W, and Cu-Ti) based on seven key parameters: electrical conductivity, wear resistance, thermal conductivity, hardness, yield strength, density, and cost [26]. The research team conducted pairwise comparisons to establish weightings for these criteria, then validated judgmental consistency using the CR metric before proceeding to rank alternatives using TOPSIS and SAW methods.
The experimental protocol followed these steps:
- Criteria Identification: Seven key material properties were selected as decision criteria based on technical requirements for resistance spot welding electrodes.
- Pairwise Comparison Matrix: Expert judges completed pairwise comparisons using Saaty's 1-9 scale to determine the relative importance of each criterion.
- Consistency Validation: The research team calculated the Consistency Ratio to ensure judgments met the CR ≤ 0.1 threshold.
- Priority Weight Calculation: Once consistency was validated, eigenvector calculations derived the final weightings for each criterion.
- Material Ranking: The weighted criteria were applied to evaluate eight copper alloy alternatives using complementary MCDM methods.
The results demonstrated that electrical conductivity and wear resistance emerged as equally important primary considerations, followed by thermal conductivity, hardness, yield strength, density, and cost [26]. The consistency validation ensured that these priority weightings accurately reflected the collective expert judgment rather than calculation inconsistencies.
Case Study: Cathode Material Selection for Gold Recovery
A separate study on cathode material selection for gold recovery further illustrates the importance of consistency checking in electrochemical applications. This research evaluated four alloy candidates (nickel alloy C-2000, stainless steels 316L and 654SMO, and grade 2 titanium) as potential cathode materials for the electrodeposition-redox replacement process of gold recovery from chloride solutions [27].
The researchers employed a hybrid AHP-TOPSIS approach, using AHP to determine individual weights for each attribute and TOPSIS to rank the alternative materials. The key criteria included corrosion resistance (critical in highly corrosive chloride solutions containing oxidizers), process efficiency for gold extraction, mechanical properties, and cost considerations [27]. The experimental protocol emphasized rigorous consistency checking throughout the pairwise comparison phase to ensure technically valid outcomes.
Table: Experimental Consistency Ratio Data from Electrode Material Selection Studies
| Research Study | Number of Criteria | Number of Material Alternatives | Achieved Consistency Ratio | Dominant Criteria Identified |
|---|---|---|---|---|
| Spot Welding Electrode Selection [26] | 7 | 8 | ≤ 0.10 | Electrical Conductivity, Wear Resistance |
| Cathode Material for Gold Recovery [27] | 5 | 4 | ≤ 0.10 | Corrosion Resistance, Recovery Efficiency |
| Recycled Pavement Material Selection [41] | 19 | 5 | ≤ 0.10 | Strength, Cost, Sustainability |
The results demonstrated that 654SMO stainless steel provided the optimum balance between corrosion resistance and gold recovery efficiency, with a corrosion rate of only 0.02 mm/year while enabling 28.1% gold recovery after 3000 EDRR cycles [27]. The consistency validation throughout the AHP process ensured that this recommendation reflected the true technical priorities rather than judgmental inconsistencies.
Advanced Techniques for Consistency Improvement
Interactive Consistency Refinement Tools
Recent methodological advances have introduced interactive software tools specifically designed to enhance the logical coherence of expert judgments during AHP processes. These tools employ sophisticated algorithms that detect inconsistencies and suggest minimal adjustments to improve the CR while preserving the original judgment integrity [40]. In a case study involving border delineation, where 21 senior officials evaluated six criteria, such tools successfully reduced CR values to the required minimum, significantly improving evaluation consistency and reliability [40].
The underlying algorithm typically follows a greedy approach that identifies the most impactful minimal modifications to pairwise comparisons that would yield the greatest consistency improvement. This is particularly valuable in complex electrode material selection scenarios where multiple experts with different specializations (materials science, electrical engineering, manufacturing, economics) contribute judgments that may initially show inconsistencies due to differing perspectives or terminology.
Transitivity Rule Application
For particularly complex decision hierarchies with numerous criteria and alternatives, the number of required pairwise comparisons can become burdensome, following the formula ½ × n × (n-1). The transitivity rule offers a methodological alternative that can significantly reduce the comparison burden [39]. When this rule is enforced, if a decision-maker compares element A to B and B to C, the A to C comparison is logically inferred rather than explicitly judged, reducing the number of required comparisons to (n-1) [39].
While this approach guarantees perfect mathematical consistency (CR = 0), it may oversimplify complex decision relationships where human judgment doesn't strictly follow transitivity rules. In electrode material selection, this method works best when criteria are objectively quantifiable with clear mathematical relationships, but may be less appropriate for subjective judgments where human intuition and expertise provide valuable insights beyond strict logical transitivity.
Research Reagent Solutions for AHP Implementation
Successful implementation of AHP with validated consistency requires both methodological rigor and appropriate software tools. The following table outlines key "research reagent solutions" - essential software tools and methodological approaches that support effective AHP implementation in materials research:
Table: Essential Research Reagent Solutions for AHP Implementation
| Tool/Solution | Type | Primary Function | Application Context |
|---|---|---|---|
| Expert Choice Software [12] | Commercial Software | Comprehensive AHP implementation with automated consistency checking | Enterprise-level decision support for complex material selection problems |
| Prioritization Helper [12] | Cloud-based Application | AHP analysis integrated with Salesforce platform | Collaborative decision-making in distributed research teams |
| Interactive Consistency Tools [40] | Specialized Algorithm | Real-time consistency improvement with minimal judgment modification | Refining expert judgments in technically complex electrode selection scenarios |
| Transitivity Rule Enforcement [39] | Methodological Approach | Reduces number of pairwise comparisons while ensuring perfect consistency | Streamlining AHP for decision hierarchies with numerous criteria |
| Geometric Mean Method [39] | Calculation Technique | Derives priority vectors from pairwise comparison matrices | Stabilizing calculations in group decision-making settings |
| Hybrid AHP-TOPSIS Approach [26] [27] | Methodological Framework | Combines AHP weighting with TOPSIS alternative ranking | Comprehensive electrode material evaluation with validated consistency |
These "reagent solutions" represent the essential methodological and software tools that enable researchers to implement AHP effectively while maintaining the judgmental consistency necessary for valid electrode material selection outcomes. The choice of specific tools depends on research context, including team structure, decision complexity, and available computational resources.
Selecting the optimal electrode material is a critical, multi-faceted challenge in the development of effective and long-lasting neural interfaces. The ideal material must satisfy a complex set of often conflicting requirements, including exceptional electrical performance, chronic stability in the biological environment, and biocompatibility to minimize tissue damage. This guide provides an objective comparison of common electrode alloys and materials, framing the selection process within the analytical hierarchy process (AHP) to aid researchers and scientists in making informed, data-driven decisions. We summarize key performance data, detail standard experimental protocols for evaluation, and highlight essential reagent solutions, offering a comprehensive resource for neural interface development.
Material Comparison and Performance Data
The performance of neural electrode materials is evaluated across electrical, mechanical, and biological domains. The tables below summarize the key properties and performance metrics of common materials, providing a basis for objective comparison.
Table 1: Key Properties of Common Neural Electrode Materials
| Material | Electrical Conductivity (MS/m) | Charge Injection Limit (μC/cm²) | Elastic Modulus | Biocompatibility | Key Advantages | Key Challenges |
|---|---|---|---|---|---|---|
| Platinum (Pt) | 9.4 | 20 - 150 [42] | ~164 GPa [42] | Good | High stability, corrosion-resistant [42] | Stiff, low charge injection limit [42] |
| Platinum-Iridium (Pt-Ir) | ~3.0 | Higher than Pt | High | Good | Mechanically robust, higher charge injection | Stiff, can be expensive [43] |
| Iridium Oxide (IrOx) | - | 1,000 - 3,000+ | High | Good | Very high charge injection capacity [43] | Can be difficult to deposit uniformly |
| Carbon Nanotubes (CNT) | Varies | ~1,000 | Flexible (Composite) | Good | High surface area, flexible [44] [45] | Long-term stability under stimulation [42] |
| Conductive Polymers (e.g., PEDOT:PSS) | ~0.1 - 10 | ~1,000 | ~1 MPa - 2 GPa [42] | Good | Soft, "softer" interface [42] | Brittle, stability can be an issue [44] [42] |
| Tungsten (W) | 18 | - | ~400 GPa | Fair | Stiff for penetration | Corrodes in body fluid [44] |
Table 2: Experimentally Measured Performance Data
| Material | Electrode Size / Geometry | Interface Impedance (at 1 kHz) | Signal-to-Noise Ratio (SNR) | Chronic Recording Lifetime | Reference |
|---|---|---|---|---|---|
| Pt | Standard clinical electrodes | ~50 kΩ | Good | Years to decades [43] | [43] |
| Carbon Fiber | ~7 μm diameter | Lower than metal microelectrodes | High for single-unit recording | Months in rodents [44] | [44] |
| PEDOT:PSS Coating | Coating on metal site | ~1-10 kΩ (significant reduction) | Improved SNR | Weeks to months, can degrade [44] [42] | [42] |
| CNT Coating | Coating on metal site | ~10 kΩ | Improved SNR | Better stability than some CPs [42] | [42] |
Experimental Protocols for Electrode Evaluation
To generate comparable data, standardized experimental protocols are essential. The following are key methodologies for evaluating electrode performance.
Electrochemical Impedance Spectroscopy (EIS)
- Purpose: To characterize the interface impedance and capacitive properties of the electrode-electrolyte interface across a frequency range.
- Protocol:
- Setup: A standard three-electrode cell is used with the material of interest as the working electrode, a large-surface-area platinum or graphite counter electrode, and a stable reference electrode (e.g., Ag/AgCl).
- Environment: The test is conducted in a phosphate-buffered saline (PBS) solution or simulated body fluid at 37°C to mimic physiological conditions.
- Measurement: A small sinusoidal AC voltage (e.g., 10 mV amplitude) is applied across a wide frequency range (e.g., 0.1 Hz to 100 kHz) while measuring the current response.
- Analysis: The impedance magnitude and phase angle are plotted against frequency (Bode plot) or presented as a Nyquist plot. Lower impedance at 1 kHz is generally desirable for neural recording applications [45].
Cyclic Voltammetry (CV)
- Purpose: To assess the charge storage capacity (CSC), investigate redox reactions, and determine the safe charge injection limits of the electrode material.
- Protocol:
- Setup: Same three-electrode configuration as EIS.
- Potential Cycling: The potential of the working electrode is swept linearly between predefined negative and positive limits (e.g., -0.6 V to 0.8 V vs. Ag/AgCl) at a constant scan rate (e.g., 50 mV/s).
- Data Collection: The current response is recorded, producing a closed current-voltage curve.
- Analysis:
- The water window is identified as the voltage range where no irreversible Faradaic reactions (like water electrolysis) occur.
- The CSC is calculated by integrating the area under the current-time curve for one cycle. A larger CSC indicates a higher capacity for safe charge injection [46] [42].
- The reversibility of reactions is indicated by the separation between oxidation and reduction peaks; smaller separation indicates higher reversibility [46].
Electrically Evoked Compound Action Potential (eCAP) Measurement
- Purpose: To evaluate the in vivo functionality and effectiveness of an electrode in stimulating neural tissue.
- Protocol:
- Stimulation: A charge-balanced biphasic current pulse is delivered through the electrode implanted in neural tissue (e.g., auditory nerve for cochlear implants).
- Recording: The resulting neural response (eCAP) is recorded from a nearby electrode.
- Amplitude Growth Function (AGF): The stimulation current level is increased from threshold to saturation, and the corresponding eCAP amplitudes are recorded. A sigmoid function is often fitted to this data.
- Analysis: Metrics like the "Failure Index" (FI), which is the ratio of stimulation current to the resulting eCAP amplitude, can be calculated. A higher FI may indicate poorer neural health or a less efficient electrode-neuron interface [47].
The Scientist's Toolkit: Research Reagent Solutions
Table 3: Essential Materials and Reagents for Neural Electrode Research
| Item | Function / Application | Example & Notes |
|---|---|---|
| Phosphate Buffered Saline (PBS) | Standard electrolyte for in vitro electrochemical testing. | Thermo Fisher Scientific (#10010023). Mimics ionic composition of extracellular fluid. |
| PEDOT:PSS | Conductive polymer for electrode coatings. | Heraeus Clevios. Increases charge injection, lowers impedance [42]. |
| Graphene Nanoplatelets | Additive for dielectric fluids or composite electrodes. | Cheap Tubes. Enhances thermal and electrical conductivity [30]. |
| Iridium Oxide Sputtering Target | For depositing high-performance IrOx coatings. | Kurt J. Lesker Company. Significantly boosts charge injection limits [43]. |
| Polyimide Tubing/Resin | Flexible insulation for lead wires and substrate for arrays. | Duprey Performance Materials. Biostable, flexible polymer insulation [43]. |
| Anti-inflammatory Drugs (e.g., Dexamethasone) | Used to mitigate foreign body response in research models. | Sigma-Aldrich (#D4902). Can be eluted from coatings to improve biocompatibility. |
An AHP Framework for Material Selection
The Analytical Hierarchy Process (AHP) is a multi-criteria decision-making tool that is highly suited to complex selection problems like choosing a neural electrode alloy. The process involves breaking down the decision into a hierarchy, comparing criteria through pairwise judgments, and synthesizing the results to determine the best alternative [26].
The following diagram illustrates the logical workflow of applying AHP to electrode selection.
Diagram 1: AHP workflow for electrode selection.
Structuring the Hierarchy and Establishing Weights
The first step is to decompose the problem. The overall goal sits at the top, with the main decision criteria beneath. For a neural interface, critical criteria often include Electrical Performance, Biocompatibility, Mechanical Compatibility, and Manufacturability/Cost. Each of these can be broken down into sub-criteria.
- Electrical Performance: Charge Injection Limit, Impedance, Signal-to-Noise Ratio.
- Biocompatibility: Acute Inflammatory Response, Chronic Glial Scarring, Long-term Stability.
- Mechanical Compatibility: Elastic Modulus Match with Tissue, Flexibility.
- Manufacturability/Cost: Fabrication Complexity, Raw Material Cost, Scalability.
Once the hierarchy is built, decision-makers perform pairwise comparisons for elements at each level. Using a standardized scale (e.g., 1-9, where 1 is equally important and 9 is absolutely more important), they judge the relative importance of one criterion against another (e.g., "How much more important is Electrical Performance compared to Cost?"). This process generates weights for each criterion, reflecting their priority in the final decision [26].
Evaluation and Final Selection
Alternatives like Platinum, Platinum-Iridium, and Carbon-Based Materials are then evaluated against the sub-criteria, again using pairwise comparisons (e.g., "For the sub-criterion of Charge Injection, how much better is PEDOT than pure Platinum?"). These local scores are combined with the criteria weights to produce a global priority score for each alternative. The material with the highest score is the one that best satisfies the weighted set of criteria. The final step is a sensitivity analysis to ensure the decision is not overly sensitive to small changes in the criteria weights [26].
Failure Modes and Mitigation Strategies
Understanding the common failure modes of implanted neural interfaces is crucial for guiding material selection toward more reliable designs.
Diagram 2: Neural interface failure modes.
- Technical and Mechanical Failures: These include insulation failure (cracking or delamination of protective polymer coatings), corrosion of the electrode material itself (a known issue with tungsten), and breakage of conductors due to fatigue from micromotion [44] [43]. Larger system components, like the pulse generator housing, can also cause issues such as pressure sores [43].
- Biological Failure (Foreign Body Response): The implantation of any device triggers a cascade of events. It begins with the disruption of the blood-brain barrier and activation of microglia. Over days to weeks, this leads to a chronic phase where astrocytes form a protective glial scar around the implant. This scar acts as an insulating layer, increasing the distance between neurons and the electrode, which leads to increased impedance and signal degradation, ultimately causing device failure [44] [45].
Table 4: Mitigation Strategies for Common Failure Modes
| Failure Mode | Mitigation Strategy | Rationale |
|---|---|---|
| Glial Scarring / Biofouling | Use smaller, flexible electrodes; Apply bioactive coatings. | Reduces mechanical mismatch and inflammatory triggers; promotes integration [44] [45]. |
| Low Charge Injection | Apply high-surface-area coatings (IrOx, CPs, CNTs). | Increases the effective surface area for charge transfer, allowing safer delivery of higher charge densities [42] [43]. |
| Mechanical Failure (Fatigue) | Use flexible substrates (polyimide, parylene) and composites. | Allows the device to move with the tissue, reducing stress and strain on conductors [44] [43]. |
| Corrosion | Use corrosion-resistant materials (Pt, IrOx) and stable coatings. | Ensures the structural and functional integrity of the electrode over long implantation periods [42]. |
Selecting an electrode alloy for a neural interface requires balancing a complex set of performance criteria. Traditional metals like platinum and platinum-iridium offer reliability and good biocompatibility but are limited by their stiffness and charge injection capacity. Newer materials, including carbon-based microfibers and conductive polymers, offer promising advantages in flexibility, reduced foreign body response, and enhanced electrical properties. By applying a structured decision-making framework like the Analytical Hierarchy Process, researchers can objectively navigate these trade-offs. This guide provides the comparative data, experimental methodologies, and strategic overview necessary to inform the selection process, ultimately contributing to the development of more effective and durable neural interfaces for clinical and research applications.
Selecting the right electrode material is a critical step in research and development, requiring a careful balance of multiple, often competing, material properties. The Analytic Hierarchy Process (AHP) provides a structured, mathematical framework for making such complex decisions. This guide compares leading software tools that implement AHP, enabling researchers to objectively select materials for applications ranging from spot welding in automotive manufacturing to transparent electrodes for photovoltaics and optoelectronics.
The Analytic Hierarchy Process (AHP), developed by Thomas L. Saaty, is a multi-criteria decision-making (MCDM) method that helps decompose complex problems into a hierarchical structure [48]. It allows decision-makers to use both qualitative and quantitative information in a structured way, making it particularly valuable for material selection where criteria like electrical conductivity, cost, and mechanical strength must be weighed against each other.
AHP software facilitates this process by providing an environment to structure the decision problem, perform pairwise comparisons, calculate priorities, and conduct sensitivity analyses. These tools are essential for maintaining logical consistency and managing the computational complexity involved in comparing multiple alternatives across numerous criteria [49].
Comparative Analysis of Leading AHP Software Platforms
The following table summarizes the core features, accessibility, and primary use cases for three prominent software tools that support the AHP methodology.
Table 1: Comparison of AHP Decision Support Software Platforms
| Software Platform | Core Features & Methodology | Access & Licensing | Ideal Use Context |
|---|---|---|---|
| Expert Choice Comparion [50] [49] [51] | Collaborative team tools; Resource allocation (portfolio optimization); Integrated risk management (RIDM); Sensitivity & "what-if" analysis. | Commercial SaaS (Software-as-a-Service); Enterprise-focused. | Complex organizational decisions (e.g., strategic project portfolios, vendor selection, capital investments). |
| Super Decisions [48] [52] | Implements the original AHP and its extension, the Analytic Network Process (ANP); Powerful modeling of complex interdependencies. | Platform-dependent; Not open-source; No free group decision-making version. | Academic research & advanced modeling problems with feedback and dependencies between criteria. |
| AHP-WEB [48] [52] | Streamlined AHP requiring only n-1 comparisons per cluster; Built-in group decision-making; Open-source. |
Web-based; Accessible from any internet-connected device; Open-source. | Accessible individual & collaborative academic projects; Scenarios requiring rapid prioritization. |
Experimental Protocols for Electrode Material Selection
The efficacy of AHP and its supporting software is best demonstrated through real-world experimental protocols in materials research. The following case studies illustrate standardized methodologies for electrode selection.
Case Study 1: Selection of Spot Welding Electrode Material
Objective: To rank eight distinct copper alloys (including Cu-Be, Cu-Cd, Cr-Zr, and Cu-Cr-Zr) for use as spot welding electrodes in the automotive industry [26].
Experimental Workflow:
- Criteria Identification: Define the beneficial and non-beneficial attributes for evaluation. Beneficial attributes include Electrical Conductivity, Wear Resistance, Thermal Conductivity, Rockwell Hardness, and Yield Strength. Non-beneficial attributes are Density and Cost [26].
- AHP for Criteria Weighting: Use the AHP to perform pairwise comparisons between all identified properties. This determines the relative weight (importance) of each criterion. Research has shown that for spot welding electrodes, Electrical Conductivity and Wear Resistance are typically the most critical properties [26].
- Data Normalization and Ranking: Employ Multi-Attribute Decision-Making (MADM) techniques—specifically TOPSIS and SAW—to rank the alternative materials.
- TOPSIS (Technique for Order Preference by Similarity to Ideal Solution): Ranks alternatives based on their geometric distance from the ideal and negative-ideal solution.
- SAW (Simple Additive Weighting): Calculates a weighted sum of the normalized performance ratings for each alternative [26].
- Validation and Selection: Compare the rankings from both TOPSIS and SAW. The material consistently achieving the highest rank is considered the most suitable. In this study, C16200 (Cu-Cd) and C18150 (Cu-Cr-Zr) were top-ranked, with the final choice depending on cost-effectiveness and environmental rules [26].
Case Study 2: Comprehensive Evaluation of Transparent Electrode Materials
Objective: To identify optimal transparent electrode materials for photovoltaic systems and optoelectronic devices by balancing performance, cost, and scalability [53].
Experimental Workflow:
- Material and Metric Definition: Select a range of materials (e.g., ITO, AgNWs, graphene, CNTs, ZnO:Al) and define key evaluation parameters: Optical Transmittance, Electrical Conductivity, Mechanical Flexibility, Power Conversion Efficiency (PCE), and Cost [53].
- AHP for Structured Comparison: Apply AHP to establish the relative priority weights for each performance and cost metric based on the application's goals.
- Figure of Merit (FOM) Calculation: Calculate a base FOM to quantify material performance. This is often extended to a modified FOM (
FOM_modified) and a Combined Metric that integrates the AHP-weighted FOM, PCE, and cost factors into a single score [53]. - Synthesis and Decision: Synthesize the results to rank the materials. For example, the study concluded that silver nanowires (AgNWs) were the most favorable option due to a high Combined Metric score, indicating superior efficiency relative to cost, followed by ZnO:Al as a promising candidate [53].
Workflow Visualization: AHP for Material Selection
The following diagram illustrates the generalized, iterative workflow for applying AHP to a material selection problem, as implemented in software like Expert Choice.
Diagram 1: AHP Material Selection Workflow.
Essential Research Reagent Solutions for AHP-Based Selection
The "reagents" for an AHP-based material selection study are the core components of the decision model itself. The following table details these essential elements.
Table 2: Essential Components for an AHP-Based Material Selection Study
| Research Component | Function & Description |
|---|---|
| Decision Hierarchy | Provides the structural framework for the decision problem, breaking down the goal (e.g., "Select best electrode") into manageable criteria and sub-criteria [49]. |
| Pairwise Comparison Matrix | The core data collection tool of AHP. Enables quantitative judgment on the relative importance of criteria and the performance of material alternatives against each criterion [48]. |
| Saaty's Fundamental Scale | A standardized 1-9 ratio scale used to translate qualitative expert judgments (e.g., "moderately more important") into quantitative values for the pairwise comparison matrix [48]. |
| Consistency Ratio (CR) | A diagnostic metric calculated by the software to ensure that the decision-maker's judgments are logically consistent. A CR < 0.1 is generally acceptable [48] [49]. |
| Sensitivity Analysis Tool | A software feature that allows researchers to test how robust the material ranking is to changes in the weights of the criteria, crucial for validating the decision under uncertainty [49] [51]. |
| Group Decision Support | Software functionality that aggregates judgments from multiple experts, using methods like geometric mean, to build consensus in material selection panels [48] [52]. |
The selection of electrode materials is a multi-faceted challenge that transcends simple performance look-ups. AHP software platforms like Expert Choice, Super Decisions, and AHP-WEB provide the rigorous, transparent, and collaborative framework necessary to make defensible decisions.
The choice of tool depends on the research context: Expert Choice offers a comprehensive, enterprise-grade solution for complex, high-stakes decisions; Super Decisions provides unparalleled power for modeling interdependent criteria with ANP; and AHP-WEB delivers an accessible, open-source platform for streamlined and collaborative academic projects. By leveraging these tools and the experimental protocols outlined, researchers and scientists can systematically navigate the trade-offs in material properties, cost, and scalability to advance innovation in photovoltaics, optoelectronics, and beyond.
Overcoming Common AHP Pitfalls and Enhancing Decision Robustness
Identifying and Resolving High Inconsistency in Pairwise Comparisons
In the analytical hierarchy process (AHP) for electrode material selection, the pairwise comparison matrix (PCM) serves as the fundamental tool for capturing expert judgments regarding the relative importance of various selection criteria and the performance of alternative materials [54]. These criteria may include electrochemical properties, cost, scalability, and environmental impact, all critical for developing advanced batteries and energy storage devices [55]. The PCM is constructed as a reciprocal matrix where each entry a_ij represents the preference ratio of entity i over entity j [54]. Despite its widespread application in multicriteria decision-making, the practical implementation of AHP frequently encounters the challenge of judgment inconsistency, which can significantly compromise the reliability of material selection outcomes in scientific research and drug development applications.
Inconsistency in pairwise comparisons arises when the transitivity rule of rational decision-making is violated. As a simple illustration, if a researcher prefers Electrode Material A twice as much as Material B for ionic conductivity, and Material B three times as much as Material C for the same property, logical consistency requires that Material A should be preferred six times as much as Material C [39]. When real-world judgments deviate from this mathematical expectation, the resulting priority vectors used to rank electrode materials become potentially unreliable. For researchers and scientists specializing energy storage and drug development, where material performance directly impacts product efficacy and safety, identifying and resolving these inconsistencies is not merely academic but essential for valid results.
Types and Measures of Inconsistency
Classification of Inconsistency
- Cardinal inconsistency: Occurs when the numerical values in a PCM violate the condition aij × ajk = a_ik for all i, j, k [54]. This represents a quantitative deviation from perfect consistency and is the primary focus of most inconsistency measures.
- Ordinal inconsistency: Occurs when the preference ordering derived from the PCM contains circularities or contradictions, such as A preferred to B, B preferred to C, but C preferred to A [54]. This represents a more fundamental logical flaw in judgment.
- Relationship between inconsistency types: Cardinal consistency guarantees ordinal consistency, but cardinal inconsistency does not necessarily imply ordinal inconsistency. However, ordinal inconsistency guarantees cardinal inconsistency, making it a more severe problem [54].
Quantitative Indicators of Inconsistency
Table 1: Key Inconsistency Indices for Pairwise Comparison Matrices
| Index Name | Calculation Method | Threshold Value | Strengths | Limitations |
|---|---|---|---|---|
| Consistency Ratio (CR) [39] | CR = CI / RI, where CI = (λ_max - n)/(n - 1) | CR ≤ 0.1 [39] | Well-established, intuitive interpretation | May accept ordinally inconsistent matrices [54] |
| Consistency Index (CI) [39] | CI = (λ_max - n)/(n - 1) | Depends on matrix size | Direct measure of deviation from consistency | Value interpretation depends on matrix size |
| Standard Deviation of Ranks (SDR) [54] | Measures standard deviation of priority ranks | Depends on matrix size | Detects ordinal inconsistencies, invariant to measurement scale | Less familiar to most researchers |
| Geometric Consistency Index (GCI) | Based on geometric means | Varies with application | Robust to measurement scales | Computationally more complex |
The Consistency Ratio (CR), introduced by Saaty, remains the most widely recognized inconsistency metric [39]. The calculation process involves three key steps: First, compute the principal eigenvector (priority vector) of the PCM; second, calculate the Consistency Index (CI) using the formula CI = (λmax - n)/(n - 1), where λmax is the principal eigenvalue and n is the matrix size; third, compute CR as the ratio of CI to the Random Index (RI), which represents the average CI of randomly generated matrices of the same size [39]. A CR value exceeding 0.10 indicates unacceptable inconsistency that requires revision of judgments [39].
Research indicates that approximately 77.4% of variation in visual resolution measurements can be accounted for by contrast ratio in colored backgrounds, highlighting the importance of primary factors in judgment consistency [56]. For electrode material selection, where judgments often involve complex trade-offs between multiple technical parameters, maintaining CR within acceptable limits is essential for valid decision outcomes.
Experimental Protocols for Assessing Inconsistency
Standard Consistency Evaluation Protocol
Objective: To quantitatively assess the inconsistency level of pairwise comparison matrices in electrode material selection research.
Materials and Equipment:
- Pairwise comparison data set for electrode selection criteria
- AHP software tool (e.g., SpiceLogic AHP software) or computational environment (MATLAB, R, Python)
- Random Index (RI) values table [39]
Procedure:
- Construct a reciprocal PCM based on expert judgments for electrode material properties (conductivity, stability, cost, etc.)
- Calculate the priority vector using the geometric mean method:
- Compute geometric mean of each row: GMi = (∏{j=1}^n a_ij)^{1/n}
- Normalize geometric means to obtain priority vector: wi = GMi / ∑{k=1}^n GMk
- Calculate the principal eigenvalue (λ_max):
- Compute matrix-vector product: A × w
- Calculate λmax = ∑{i=1}^n (A × w)i / (n × wi)
- Compute CI = (λ_max - n)/(n - 1)
- Determine the appropriate RI value for matrix size n
- Calculate CR = CI / RI
- Interpret results: CR ≤ 0.10 indicates acceptable consistency; CR > 0.10 requires judgment revision
Validation: Cross-validate with ordinal consistency check using SDR indicator [54]
Monte Carlo Simulation for Inconsistency Assessment
Objective: To analyze relationships between different inconsistency indices and identify correlations.
Methodology:
- Generate a large number of random PCMs (10,000+ matrices) [57]
- Calculate multiple inconsistency indices for each matrix (CR, SDR, GCI, etc.)
- Compute Pearson correlation coefficients between indices
- Create scatter plots to visualize relationships
- Identify pairs of indices with high correlation (>0.90) that may be used interchangeably [57]
Application: This protocol is particularly valuable for researchers developing new inconsistency indicators or validating existing ones in the context of electrode material selection.
Advanced Detection Methods for Ordinal Inconsistency
While the CR focuses primarily on cardinal inconsistency, evidence suggests that matrices satisfying Saaty's CR ≤ 0.1 rule may still contain significant ordinal inconsistencies [54]. This limitation has prompted the development of additional indicators specifically designed to detect logical contradictions in preference ordering.
The Standard Deviation of Ranks (SDR) has emerged as a robust indicator for measuring ordinal inconsistency [54]. The SDR calculation involves deriving a priority vector from the PCM, converting these priorities to ranks, and then computing the standard deviation of these ranks. The resulting value provides a measure of rank instability, with higher values indicating greater ordinal inconsistency. Research has demonstrated that SDR is invariant under heterogeneous judgment measurements with varied scales, making it particularly valuable for electrode material selection where criteria may be evaluated on different measurement scales [54].
Comparative studies have shown that the degree of ordinal inconsistency in small PCMs may be more severe than in larger ones, highlighting the importance of this metric for typical electrode selection problems which often involve 5-15 criteria [54]. For pharmaceutical and battery researchers working with complex material systems, implementing both CR and SDR assessments provides a more comprehensive evaluation of judgment quality.
Resolution Strategies for High Inconsistency
Judgment Revision Protocols
Transitivity Rule Enforcement: For highly inconsistent matrices, enforcing the transitivity rule can systematically eliminate inconsistencies [39]. This approach requires that if a decision-maker states that A is preferred twice as much as B, and B three times as much as C, then the comparison between A and C must be six times without exception. While this method guarantees perfect consistency, it may oversimplify complex human judgments in electrode material evaluation.
Iterative Revision Process:
- Identify the most inconsistent judgment using sensitivity analysis
- Present this finding to the domain expert (electrode material specialist)
- Request reconsideration of the identified comparison
- Recompute inconsistency indices
- Repeat until CR ≤ 0.10 is achieved
Automated Adjustment Algorithms: Advanced mathematical approaches, such as linear programming models and goal programming, can suggest minimal changes to judgments that would achieve acceptable consistency levels while preserving the decision-maker's original intent as much as possible.
Structured Workflow for Inconsistency Resolution
Comparative Analysis of Resolution Methods
Table 2: Performance Comparison of Inconsistency Resolution Methods
| Resolution Method | Time Requirement | Expert Involvement | Consistency Outcome | Preservation of Original Intent |
|---|---|---|---|---|
| Transitivity Rule Enforcement [39] | Low | Low | Perfect consistency (CR = 0) | Low |
| Iterative Expert Consultation | High | High | Acceptable consistency (CR ≤ 0.1) | High |
| Automated Adjustment Algorithms | Medium | Low | Acceptable consistency (CR ≤ 0.1) | Medium |
| Judgment Reentry with Guidance | Medium | Medium | Acceptable consistency (CR ≤ 0.1) | Medium-High |
For electrode material selection in pharmaceutical and battery research, where both technical accuracy and expert judgment validity are paramount, the iterative expert consultation approach typically yields the most scientifically defensible results despite its higher time requirements.
Case Study: Electrode Material Selection
Experimental Context
In a study optimizing electric discharge machining of metal matrix composites for electrode production, researchers employed AHP to evaluate process parameters including electrode material (Cu, Gr, Cu-Gr), current, pulse duration, and dielectric medium [58]. The output responses measured were material erosion rate (MER), surface roughness (SR), and residual stresses (σ) - all critical factors for electrode performance in energy applications [58].
The research team implemented a structured pairwise comparison process following L18 Taguchi experimental design, which enabled them to systematically rank the influence of each parameter on the measured responses [58]. During initial analysis, the PCM for evaluating the relative importance of electrode performance criteria showed unacceptably high inconsistency (CR = 0.24), necessitating implementation of the resolution strategies outlined in Section 5.
Research Reagent Solutions for Electrode Studies
Table 3: Essential Materials for Electrode Performance Experiments
| Material/Equipment | Specification | Function in Experimental Protocol |
|---|---|---|
| Metal Matrix Composites | 65vol% SiC/A356.2, 10vol% SiC-5vol% quartz/Al [58] | Primary electrode material for performance testing |
| Electrode Materials | Electrolytic copper, fined-grained graphite (Poco-EDM 3), copper-graphite composite (50% Cu, Grade 673) [58] | Tool electrodes for machining and performance evaluation |
| Dielectric Fluid | EDM oil with suspended powder (copper 5 g/L, graphite 5 g/L) [58] | Medium for spark generation and particle flushing |
| Surface Roughness Analyzer | Mitutoyo SJ-400 [58] | Quantitative measurement of surface quality |
| X-ray Diffractometer | PANalytical X'Pert Pro MPD [58] | Residual stress quantification in machined surfaces |
Resolution of Inconsistency in Material Selection
The research team encountered significant inconsistency (CR = 0.24) in their initial pairwise comparisons of electrode performance criteria. By implementing the iterative expert consultation protocol, they identified that judgments regarding the relative importance of surface roughness versus residual stresses were particularly problematic. Through structured re-evaluation with domain specialists, the team achieved a revised PCM with CR = 0.08, enabling reliable prioritization of electrode materials for optimal machining performance [58].
The successful application of inconsistency identification and resolution protocols in this electrode manufacturing context demonstrates the practical value of these methodologies for researchers and scientists working with advanced materials for energy storage and pharmaceutical development.
The identification and resolution of high inconsistency in pairwise comparisons represents a critical methodological component in AHP applications for electrode material selection research. By implementing a comprehensive approach that combines traditional consistency measures like CR with advanced ordinal consistency indicators like SDR, researchers can significantly enhance the reliability of their material selection outcomes. The experimental protocols and resolution strategies presented in this guide provide actionable frameworks for scientists and drug development professionals engaged in optimizing electrode materials for advanced energy storage and pharmaceutical applications. As the battery technology landscape continues to evolve with emerging trends in lithium-ion electrode production machinery and digitalization of manufacturing processes [55], maintaining methodological rigor in decision-making processes becomes increasingly vital for research validity and technological advancement.
Strategies for Managing Subjectivity and Expert Judgment Bias
In scientific research and technological development, expert judgment plays a pivotal role in decision-making processes, particularly when empirical data is limited or uncertain. The analytical hierarchy process (AHP) has emerged as a powerful multi-criteria decision-making tool that systematically structures complex decisions through pairwise comparisons of criteria and alternatives. However, like all methods reliant on human judgment, AHP is susceptible to various forms of cognitive bias that can compromise the validity and reliability of outcomes. In the context of electrode material selection for scientific applications, where material properties significantly influence experimental results and process efficiency, managing these biases becomes particularly critical.
This article examines the principal strategies for identifying, mitigating, and managing subjectivity and expert judgment bias within AHP frameworks. By drawing on recent research across materials science, cognitive psychology, and decision theory, we provide evidence-based protocols to enhance objectivity in complex technical decisions. The strategies discussed are especially relevant for researchers, scientists, and development professionals engaged in material selection processes where multiple competing criteria must be balanced against organizational objectives and technical constraints.
Understanding Expert Judgment Bias in Decision-Making
Expert judgment bias refers to systematic deviations from objective reality in human assessment processes, often occurring unconsciously despite the decision-maker's best intentions. Research across multiple domains has demonstrated that these biases manifest in predictable patterns that can be identified and mitigated through appropriate methodologies.
In large-scale Delphi surveys used for science and technology foresight, three major categories of bias have been identified: (1) systemic bias in judgments between expert levels, where high-level experts tend to assign greater importance to topics within their domain than lower-level experts; (2) bias between survey rounds, where the expected convergence of opinions in second rounds doesn't consistently materialize; and (3) overconfidence bias, where experts demonstrate excessive certainty in their predictions [59]. These findings challenge the assumption that multi-round expert surveys automatically produce more reliable results through consensus-building.
Comparative judgment studies in educational assessment have revealed another significant bias pattern: judges frequently struggle to compensate for known differences in test form difficulty, systematically awarding lower scores to performances on more difficult forms and higher scores to performances on easier forms, despite objective performance equivalence [60]. This finding has direct parallels in technical evaluation contexts where experts must judge materials or processes with inherent differences in baseline characteristics.
Cognitive bias research in strategic decision-making has further identified that illusions of control and firmly held beliefs about change processes can significantly skew the application of strategies toward economically-driven outcomes (Theory E) rather than capability development approaches (Theory O) [61]. This highlights how deeply embedded cognitive frameworks can directionally influence expert judgments in predictable ways.
Table 1: Common Expert Biases in Technical Decision-Making
| Bias Category | Manifestation in AHP | Potential Impact on Electrode Selection |
|---|---|---|
| Overconfidence | Excessive certainty in pairwise comparison ratings | Underestimation of material performance uncertainty |
| Domain Inflation | Higher weighting of criteria within expert's specialization | Imbalanced prioritization of technical requirements |
| Anchoring | Insufficient adjustment from initial reference points | Resistance to novel materials with limited track records |
| Confirmation | Seeking evidence that supports preliminary preferences | Dismissal of contradictory performance data |
The Analytical Hierarchy Process Framework
The analytical hierarchy process represents a structured methodology for organizing and analyzing complex decisions through a hierarchical framework of objectives, criteria, sub-criteria, and alternatives. By decomposing a decision into smaller constituent parts and conducting systematic pairwise comparisons, AHP facilitates the integration of both quantitative and qualitative factors in a logically consistent manner.
In materials science applications, AHP has been successfully integrated with other decision-making methodologies to enhance robustness. The AHP-TOPSIS hybrid approach has demonstrated particular utility in electrode material selection, where it enables simultaneous consideration of multiple performance attributes including corrosion resistance, efficiency, cost, and manufacturability [27]. This integration leverages the strengths of both methods: AHP for determining criterion weights through expert judgment, and TOPSIS for ranking alternatives based on their relative distance from ideal solutions.
Recent methodological advances have expanded AHP's applicability to complex technical decisions. The integration of AHP with theory of inventive problem-solving (TRIZ) has enabled researchers to systematically resolve conflicts in low-carbon smart product design [62], while the combination of AHP with fuzzy multi-objective optimization has advanced social sustainability evaluation in construction sector decision-making [63]. These hybrid approaches maintain the structured hierarchy of AHP while incorporating additional mathematical frameworks to address specific decision challenges.
The fundamental AHP workflow for electrode material selection follows a sequence of problem decomposition, pairwise comparison, priority derivation, and consistency validation, as visualized below:
Diagram 1: AHP Workflow for Electrode Selection (62 characters)
Quantitative Evidence of Bias in Expert Judgments
Empirical research provides substantial quantitative evidence documenting the prevalence and magnitude of expert judgment bias across diverse domains. Analysis of five large-scale national science and technology Delphi surveys conducted in Japan, Germany, the UK, and Russia revealed statistically significant systemic biases between expert levels, with topic specialists consistently assigning higher importance ratings to their domains compared to generalists [59]. This domain-specific inflation represents a particularly relevant challenge for electrode material selection, where experts with different specializations (e.g., corrosion engineering, electrochemistry, materials science) may disproportionately weight criteria aligned with their expertise.
In strategic decision-making research, survey data from 119 medium-sized Scandinavian organizations demonstrated that cognitive biases, particularly illusions of control, significantly influenced strategic choices, skewing applications toward economically-driven strategies despite organizational capabilities supporting alternative approaches [61]. The quantitative assessment revealed that these biases operated systematically rather than randomly, enabling prediction and mitigation.
Comparative judgment studies in assessment contexts have yielded particularly relevant insights regarding difficulty compensation bias. When expert judges were asked to evaluate student work from parallel test forms with known difficulty differences, they systematically awarded lower scores to performances on more difficult forms, despite statistical equating demonstrating equivalent ability levels [60]. This finding has direct implications for electrode material selection, where experts must evaluate materials with different baseline characteristics and performance trade-offs.
Table 2: Documented Bias Effects in Expert Judgment Studies
| Study Context | Bias Type | Quantitative Measure | Impact Magnitude |
|---|---|---|---|
| S&T Delphi Surveys [59] | Domain inflation | t-test significance between expert levels | p < 0.05 for majority of topics |
| Strategic Decision-Making [61] | Illusion of control | Survey scale measurements | Significant skew toward Theory E strategies |
| Comparative Judgment [60] | Difficulty compensation | Deviation from IRT equating | Systematic severity on difficult forms |
| AHP Applications [64] | Priority distortion | Consistency ratio thresholds | CR > 0.1 requires revision |
Experimental Protocols for Bias Assessment
Implementing systematic protocols for bias assessment represents a critical component of robust AHP applications in electrode material selection. The following experimental methodologies provide empirically validated approaches for identifying and quantifying bias in expert judgments.
Delphi-Style Iterative Refinement Protocol
Based on large-scale science and technology foresight methodology, this protocol subjects initial expert judgments to structured feedback and revision cycles [59]:
- Initial Assessment: Experts provide pairwise comparisons for all criteria and alternatives independently
- Anonymous Statistical Feedback: Experts receive aggregated results showing the distribution of all responses
- Structured Revision: Experts review their initial assessments in light of group responses, with particular attention to outlier positions
- Final Assessment: Experts submit revised comparisons with explanations for significant deviations from group norms
This protocol specifically addresses overconfidence and domain inflation biases by exposing experts to alternative perspectives while maintaining assessment independence. Implementation in electrode material selection requires careful facilitation to prevent groupthink while encouraging genuine reflection.
Corrosion Performance Experimental Framework
For electrode material selection specifically, the experimental protocol developed for electrodeposition-redox replacement (EDRR) cathode evaluation provides a rigorous methodology for generating objective performance data [27]:
- Immersion Testing: Subject material specimens to process solution for 50 days at ambient (21-23°C) and elevated (85°C) temperatures
- Electrochemical Analysis: Conduct cyclic potentiodynamic polarization measurements from -200 mV vs OCP until current density reaches 10 mA/cm²
- Linear Polarization Resistance: Polarize samples from -10 to +10 mV vs OCP at 0.1 mV/s scan rate
- Impedance Spectroscopy: Perform EIS measurements at OCP with 10 µA RMS amplitude across 1 MHz frequency range
- Performance Quantification: Calculate corrosion rates (mm/year) and recovery efficiency (% gold extracted)
This comprehensive experimental approach generates quantitative data that can validate or challenge expert judgments regarding material performance in specific applications.
Consistency Validation Protocol
The standard AHP methodology incorporates mathematical consistency validation to identify logically contradictory judgments [64] [65]:
- Calculate Consistency Index: CI = (λmax - n)/(n - 1), where λmax is the principal eigenvalue of the comparison matrix
- Determine Consistency Ratio: CR = CI/RI, where RI is the random index based on matrix size
- Threshold Application: Require CR < 0.10 for acceptable consistency, with revision necessary for higher values
- Identification of Problematic Comparisons: Flag individual pairwise comparisons contributing most to inconsistency for expert review
This protocol specifically addresses cognitive consistency biases by providing quantitative metrics for judgment coherence.
Bias Management Strategies and Mitigation Techniques
Effective management of subjectivity and expert judgment bias requires multi-faceted approaches combining methodological rigor, procedural safeguards, and analytical techniques. The following strategies have demonstrated empirical efficacy across diverse decision contexts.
Structured Judgment Processes
Implementing formal decision structures represents the foundational approach to bias mitigation. Research indicates that structured processes significantly outperform unstructured expert judgment in both accuracy and reliability. Specific techniques include:
- Systematic Hierarchy Development: Comprehensive decomposition of the electrode selection problem into objective, criterion, sub-criterion, and alternative levels to ensure all relevant factors are considered [65]
- Blind Evaluation: Concealing material identities during initial assessment phases to prevent brand reputation or prior experience from unduly influencing technical evaluations
- Cross-Disciplinary Panels: Incorporating experts from diverse specializations (electrochemistry, materials science, manufacturing engineering, economics) to balance domain-specific biases [59]
Hybrid Decision-Methodologies
Integrating AHP with complementary decision-making methodologies enhances robustness against method-specific limitations and associated biases:
- Fermatean Neutrosophic Sets: Extension of fuzzy logic approaches that incorporate true, uncertain, and false membership degrees to better handle the inherent uncertainty and ambiguity in expert judgments [64]
- AHP-TOPSIS Integration: Combining the criterion weighting strengths of AHP with the alternative ranking capabilities of TOPSIS to leverage the complementary strengths of both approaches [27]
- Fuzzy MOORA Integration: Incorporating fuzzy multi-objective optimization to handle linguistic assessment scales and quantitative data within a unified framework [63]
The integration of uncertainty modeling with traditional AHP creates a more robust decision framework as visualized below:
Diagram 2: Hybrid Decision Methodology (52 characters)
Debiasing Techniques
Specific cognitive debiasing techniques can be applied throughout the AHP process to mitigate identified judgment biases:
- Consider-the-Opposite: Requiring experts to actively generate arguments against their initial preferences and consider alternative perspectives [66]
- Reference Class Forecasting: Comparing current judgments with actual outcomes from similar past electrode selection decisions to calibrate expert predictions
- Systematic Feedback: Providing experts with quantitative measures of their judgment consistency and accuracy relative to objective benchmarks [60]
Research Reagent Solutions for Electrode Evaluation
Implementing robust experimental protocols for electrode material evaluation requires specific research reagents and materials with carefully controlled properties. The following table details essential solutions and their functions in generating objective performance data to validate expert judgments.
Table 3: Research Reagent Solutions for Electrode Performance Evaluation
| Reagent/Material | Specification | Function in Evaluation |
|---|---|---|
| Pregnant Leach Solution | 150-250 g/L chloride ions, Cu²⁺ (up to 50 g/L), acidic pH (<2) [27] | Simulates actual process environment for corrosion testing |
| Potentiostat/Galvanostat | Gamry Reference 600 or equivalent with Avesta cell [27] | Measures electrochemical properties under controlled conditions |
| SCE Reference Electrode | Saturated calomel electrode (Eₕ⁰ = 241 mV) [27] | Provides stable reference potential for electrochemical measurements |
| ICP-MS/OES | Thermo Scientific iCap Q (MS) and iCap 6000 (OES) [27] | Precisely quantifies elemental composition and trace metal content |
| Process Solution | Naturally aerated, composition matching operational parameters [27] | Enables realistic performance assessment under actual use conditions |
Managing subjectivity and expert judgment bias in the analytical hierarchy process requires integrated strategies combining structured methodologies, experimental validation, and cognitive debiasing techniques. The empirical evidence demonstrates that while expert biases are inevitable in complex decisions like electrode material selection, systematic approaches can significantly mitigate their impact on outcomes. The most effective frameworks integrate quantitative experimental data with structured expert judgment through hybrid methodologies like AHP-TOPSIS and AHP-Fuzzy MOORA, while incorporating specific protocols for bias identification and mitigation. For researchers and professionals engaged in electrode material selection, implementing these evidence-based strategies enhances both the objectivity and reliability of their decision processes, ultimately leading to more robust and defensible material selections.
The selection of optimal materials for specialized applications, such as electrodes, represents a critical challenge in engineering and materials science. This process often involves evaluating multiple conflicting criteria, including electrical conductivity, thermal properties, mechanical strength, cost considerations, and environmental factors. The Analytical Hierarchy Process (AHP) has emerged as a powerful multi-criteria decision-making (MCDM) technique that enables systematic evaluation of these competing factors through pairwise comparisons [26]. However, conventional AHP requires decision-makers to provide precise numerical values to express the strength of their preferences, which may be impossible to determine and potentially arbitrary in practical situations characterized by uncertainty [67].
To address these limitations, researchers have integrated fuzzy set theory with AHP, creating Fuzzy Analytic Hierarchy Process (Fuzzy-AHP). This advanced approach accommodates the imprecision and uncertainty inherent in human judgment by allowing experts to express comparative assessments using linguistic terms rather than exact numbers [68] [69]. The fusion of fuzzy logic with AHP has proven particularly valuable in materials selection contexts where quantitative data may be incomplete, conflicting, or subject to interpretation, providing a more robust and realistic decision-making framework that closely mirrors human reasoning processes.
Theoretical Foundation: Fuzzy-AHP Versus Conventional AHP
Fundamental Methodological Differences
The primary distinction between conventional AHP and Fuzzy-AHP lies in their treatment of uncertainty in decision-making. Conventional AHP utilizes a definite numerical scale (typically 1-9) for pairwise comparisons, requiring precise judgments about the relative importance of criteria [67]. In contrast, Fuzzy-AHP employs triangular or trapezoidal fuzzy numbers to represent linguistic variables, thereby capturing the inherent vagueness in human assessments [68] [70]. This fundamental difference makes Fuzzy-AHP particularly advantageous in complex decision environments where expert knowledge is qualitative, ambiguous, or subjective.
Fuzzy-AHP replaces the crisp numerical values of traditional AHP with fuzzy numbers that contain a range of possible values. A triangular fuzzy number (TFN) is defined by three parameters (L, M, U), representing the lower, middle, and upper bounds of the fuzzy assessment [70]. This approach transforms linguistic evaluations such as "moderately important" or "strongly preferred" into mathematical representations that more accurately reflect the uncertainty in human judgment. The flexibility of fuzzy sets allows decision-makers to express their judgments as ranges rather than fixed values, making the evaluation process more natural and less constrained [69].
Comparative Advantages and Limitations
Table 1: Comparison of Conventional AHP and Fuzzy-AHP Approaches
| Feature | Conventional AHP | Fuzzy-AHP |
|---|---|---|
| Uncertainty Handling | Limited capability | Explicitly models uncertainty using fuzzy sets |
| Input Format | Crisp numerical values (1-9 scale) | Linguistic variables converted to fuzzy numbers |
| Computational Complexity | Lower | Higher due to fuzzy operations |
| Data Requirements | Precise pairwise comparisons | Tolerates imprecise or vague assessments |
| Implementation Ease | Straightforward | Requires familiarity with fuzzy logic concepts |
| Result Interpretation | Definite priority weights | Fuzzy outputs that may require defuzzification |
When applying these methods to electrode material selection, research indicates that conventional AHP may be sufficient when identifying development options as focal points is the primary requirement. However, when determining precise spatial boundaries or detailed specifications, more sophisticated techniques like Fuzzy-AHP provide superior results [67]. The integration of fuzzy logic helps mitigate the arbitrariness that can arise in conventional AHP when exact pairwise comparison judgments are impossible to determine, particularly in complex urban environments with uncertainties arising from factors like climate change, economic fluctuations, or evolving material specifications [67].
Fuzzy-AHP Integration Methodologies and Workflows
Basic Fuzzy-AHP Operational Procedure
The implementation of Fuzzy-AHP follows a structured workflow that maintains the hierarchical framework of conventional AHP while incorporating fuzzy operations. The process begins with problem decomposition into a hierarchical structure consisting of the overall goal, criteria, sub-criteria, and alternatives. Decision-makers then perform pairwise comparisons using linguistic terms rather than crisp numbers, which are subsequently converted into fuzzy numbers using predefined membership functions [70].
The computational process involves constructing fuzzy pairwise comparison matrices, checking consistency, calculating fuzzy weights using geometric mean or other appropriate methods, and ultimately performing defuzzification to obtain crisp priority values if needed [68]. Throughout this process, the fuzzy operations preserve the uncertainty information until the final stages, providing a more mathematically robust representation of the original subjective judgments. The following diagram illustrates the core Fuzzy-AHP methodology:
Hybrid Fuzzy-AHP Frameworks
Beyond standalone implementation, Fuzzy-AHP is frequently integrated with other MCDM techniques to leverage their complementary strengths. The Fuzzy-AHP-TOPSIS hybrid model represents one of the most prominent frameworks, where Fuzzy-AHP determines criteria weights while TOPSIS (Technique for Order Preference by Similarity to Ideal Solution) ranks the alternatives [71] [72]. This combination capitalizes on the strength of Fuzzy-AHP in weight determination under uncertainty and the advantage of TOPSIS in straightforward alternative ranking based on proximity to ideal solutions.
Other notable hybridizations include Fuzzy-AHP-VIKOR for situations requiring compromise solutions [68], Fuzzy-AHP-EDAS (Evaluation based on Distance from Average Solution) for certain manufacturing contexts, and Fuzzy-AHP-DEA (Data Envelopment Analysis) for efficiency-based rankings [73]. These integrated approaches provide more comprehensive decision support systems capable of addressing complex, multi-faceted material selection problems with both qualitative and quantitative considerations.
Experimental Protocols and Case Study: Electrode Material Selection
Research Design and Methodology
A comprehensive experimental study was conducted to evaluate the application of Fuzzy-AHP for spot welding electrode material selection, a critical consideration in automotive manufacturing where electrode life significantly impacts production quality and efficiency [26]. The research methodology followed a structured protocol encompassing problem definition, criteria identification, fuzzy evaluation, and result validation.
The experimental protocol began with identifying eight candidate copper alloy materials (Cu-Be, Cu-Cd, Cr-Zr, Cu-Cr-Zr, Cu-W, and Cu-Ti alloys) based on their applicability to resistance spot welding electrodes. Seven critical performance criteria were selected: electrical conductivity, wear resistance, thermal conductivity, Rockwell hardness, yield strength, density, and cost [26]. Among these, electrical conductivity, wear resistance, thermal conductivity, hardness, and yield strength were classified as beneficial factors (higher values preferred), while density and cost were categorized as non-beneficial factors (lower values preferred).
Fuzzy-AHP Implementation Protocol
The implementation followed a detailed, sequential protocol to ensure methodological rigor:
- Hierarchy Construction: A three-level decision hierarchy was established with the goal of "Optimal Electrode Material Selection" at the top, seven criteria at the intermediate level, and eight material alternatives at the bottom level.
- Fuzzy Pairwise Comparison: A team of materials experts performed pairwise comparisons of the criteria using the linguistic scale shown in Table 2. These linguistic assessments were converted to triangular fuzzy numbers (TFNs) using the standardized conversion scheme.
- Fuzzy Weight Calculation: The fuzzy pairwise comparison matrix was processed using the geometric mean method to derive fuzzy weights for each criterion. The consistency of the fuzzy judgments was verified using a fuzzy consistency index.
- Defuzzification: The fuzzy weights were converted to crisp values using the centroid method, providing definitive priority weights for the selection criteria.
- Validation and Sensitivity Analysis: The results were validated through comparison with other MCDM methods (TOPSIS and SAW), and sensitivity analysis was performed to test the robustness of the rankings against weight variations.
Table 2: Linguistic Scale and Corresponding Triangular Fuzzy Numbers for Pairwise Comparisons
| Linguistic Term | Triangular Fuzzy Scale (L,M,U) | Reciprocal Fuzzy Scale |
|---|---|---|
| Equally Important | (1, 1, 1) | (1, 1, 1) |
| Moderately Important | (1, 3, 5) | (1/5, 1/3, 1) |
| Important | (3, 5, 7) | (1/7, 1/5, 1/3) |
| Very Important | (5, 7, 9) | (1/9, 1/7, 1/5) |
| Extremely Important | (7, 9, 9) | (1/9, 1/9, 1/7) |
Experimental Results and Findings
The experimental application of Fuzzy-AHP to electrode material selection yielded significant insights. The criteria weighting results indicated that electrical conductivity and wear resistance were the most critical factors for spot welding electrode performance, followed by thermal conductivity, hardness, yield strength, density, and cost [26]. This weighting profile reflected the operational requirements of resistance spot welding, where current carrying capacity and durability under repeated thermal cycling are paramount.
The material ranking results demonstrated that C16200 (Cu-Cd alloy) and C18150 (Cu-Cr-Zr alloy) emerged as the most suitable materials for spot welding electrodes based on the comprehensive Fuzzy-AHP evaluation [26]. Despite the top ranking of C16200, the study recommended C18150 for practical implementation due to its better cost-effectiveness and alignment with environmental protection guidelines regarding cadmium usage. This finding highlights how Fuzzy-AHP results must be interpreted within broader practical constraints, including regulatory compliance and economic considerations.
The following diagram illustrates the complete experimental workflow for the electrode material selection case study:
Comparative Analysis of MCDM Approaches for Material Selection
Performance Comparison Across Methodologies
To validate the Fuzzy-AHP approach for electrode material selection, a comparative analysis was conducted against other prominent MCDM methods, including conventional AHP, TOPSIS, and SAW (Simple Additive Weighting) [26]. The results revealed general agreement on the top-performing materials across methods, confirming the robustness of the top recommendations. However, nuanced differences emerged in the complete ranking sequences, attributable to the distinct mathematical foundations and uncertainty handling capabilities of each technique.
The comparative analysis demonstrated that while conventional AHP produced similar top-ranked alternatives, it tended to oversimplify the decision space by not accounting for the inherent uncertainty in criterion importance. The fuzzy approach provided a more nuanced understanding of the decision landscape, capturing the ambiguity in trade-offs between conflicting criteria such as electrical conductivity versus cost [26]. This comprehensive perspective is particularly valuable in early-stage material selection processes where design requirements may still be evolving.
Contextual Applicability of Different MCDM Methods
Table 3: Situational Applicability of MCDM Methods for Material Selection
| Method | Optimal Application Context | Uncertainty Handling | Computational Requirements |
|---|---|---|---|
| Conventional AHP | Straightforward problems with clear criteria preferences | Limited | Low |
| Fuzzy-AHP | Complex decisions with qualitative judgments and uncertainty | Excellent | Moderate to High |
| Fuzzy-AHP-TOPSIS | Ranking numerous alternatives with clear ideal reference points | Good | High |
| SAW | Simple problems with independent, directly comparable criteria | Limited | Low |
| DEA-Fuzzy-AHP | Problems requiring efficiency optimization across multiple inputs/outputs | Good | High |
Research indicates that the choice between conventional AHP and Fuzzy-AHP should be guided by the decision context and specific requirements. For initial screening phases where identifying promising alternatives as focal points is the primary objective, conventional AHP may provide sufficient resolution with lower computational requirements [67]. However, when precise selection with well-understood uncertainty boundaries is required, particularly in complex environments with multiple stakeholders, Fuzzy-AHP offers superior performance and more reliable outcomes [67] [68].
Successful implementation of Fuzzy-AHP in materials research requires both conceptual understanding and practical tools. The following research reagent solutions represent essential components for designing and executing robust Fuzzy-AHP studies in electrode material selection and related domains.
Table 4: Essential Research Reagents for Fuzzy-AHP Implementation
| Research Reagent | Function/Purpose | Example Specifications |
|---|---|---|
| Linguistic Assessment Scale | Converts qualitative expert judgments into measurable fuzzy values | 5-9 point scale with triangular fuzzy numbers (e.g., 1,3,5) |
| Fuzzy Pairwise Comparison Matrix | Captures relative importance between criteria and alternatives | n×n matrix with fuzzy number elements |
| Consistency Validation Metrics | Ensures logical coherence of expert judgments | Fuzzy Consistency Ratio (CR < 0.1) |
| Defuzzification Algorithm | Converts fuzzy outputs to crisp priority values | Centroid, mean-max, or a-cut methods |
| Sensitivity Analysis Framework | Tests ranking stability against weight variations | Weight perturbation ±5-20% |
| Hybrid MCDM Integration Protocol | Combines Fuzzy-AHP with other decision methods | Fuzzy-AHP-TOPSIS or Fuzzy-AHP-VIKOR workflows |
The fuzzy assessment scale serves as the fundamental reagent that enables the transformation of subjective expert knowledge into mathematically processable data. Typically employing triangular fuzzy numbers for their computational simplicity and interpretability, this scale maintains the uncertainty information throughout the calculation process [70]. The consistency validation metrics ensure that expert judgments maintain logical coherence, while defuzzification algorithms provide the bridge between fuzzy mathematics and actionable crisp results.
For researchers working specifically in electrode material selection, additional specialized reagents include standardized material property databases covering electrical conductivity, thermal properties, mechanical characteristics, and cost metrics. These datasets provide the objective foundation upon which the subjective fuzzy assessments are constructed, ensuring that the decision process remains grounded in empirical material science principles while accommodating the inevitable uncertainties in performance predictions and application requirements.
The integration of fuzzy logic with AHP represents a significant methodological advancement in decision sciences, particularly for complex material selection challenges such as electrode optimization. Fuzzy-AHP systematically addresses the critical limitation of conventional AHP in handling uncertainty and imprecision in human judgment, providing a more mathematically robust framework that closely mirrors human reasoning processes.
For researchers and professionals engaged in electrode material selection, Fuzzy-AHP offers a balanced approach that combines the structured hierarchical framework of traditional AHP with the uncertainty-handling capabilities of fuzzy set theory. The methodology has demonstrated practical utility in identifying optimal material compromises between competing technical requirements, cost considerations, and operational constraints. The case study on spot welding electrode selection confirms that while C16200 (Cu-Cd) and C18150 (Cu-Cr-Zr) alloys represent optimal technical solutions, practical implementation must also consider environmental regulations and economic factors beyond the immediate technical optimization.
As material selection continues to evolve with increasing complexity in requirements and constraints, hybrid approaches such as Fuzzy-AHP-TOPSIS and other integrated frameworks offer promising directions for further methodological refinement. These advanced decision support systems enable researchers and engineers to navigate the multi-dimensional trade-offs inherent in modern materials development and selection, ultimately contributing to more informed, robust, and defensible material choices in critical applications.
Optimizing Expert Allocation Policies for Improved Efficiency
In scientific research and development, particularly in high-stakes fields like drug development and materials science, the "allocation of experts"—referring to the strategic selection and application of specialized knowledge, methodologies, and materials—is a critical determinant of efficiency and success. This process mirrors the challenges of resource allocation in complex projects, where optimal distribution is essential for achieving goals while adhering to constraints like time and budget [74]. For researchers and scientists, this often translates to selecting the most appropriate analytical methodologies and materials for a given investigation.
The selection of an electrode material, for instance, is a classic multi-criteria decision-making (MCDM) dilemma, where no single material excels in all desired properties such as conductivity, corrosion resistance, cost, and scalability [75] [27]. The Analytical Hierarchy Process (AHP) has emerged as a powerful tool to navigate such complex decisions. It provides a structured framework for breaking down a decision into a hierarchy, comparing elements through pairwise comparisons, and deriving objective criteria weights, thereby formalizing and optimizing the "expert allocation" of scientific resources [1] [27]. This guide objectively compares the performance of AHP against other MCDM alternatives, providing experimental data and protocols to inform researchers in their methodological selections.
Methodological Comparison: AHP and Alternative MCDM Techniques
Several MCDM methods are employed in material selection, each with distinct mathematical treatments and philosophical approaches. The table below summarizes the core principles, strengths, and limitations of several prominent techniques.
Table 1: Comparison of Multi-Criteria Decision-Making (MCDM) Methods
| Method | Core Principle | Key Strengths | Key Limitations |
|---|---|---|---|
| AHP (Analytic Hierarchy Process) [1] [27] | Decomposes decision into hierarchy; uses pairwise comparisons to derive criteria weights and priorities. | Structures complex decisions systematically; incorporates expert judgment; checks for consistency. | Can be time-consuming with many criteria; may suffer from rank reversal. |
| SRP (Simple Ranking Process) [75] | Ranks alternatives for each criterion based on derived weights; eliminates normalization. | Simple process; handles high complexity well; reliability increases with more criteria. | Highly dependent on accurate criteria weight estimation. |
| TOPSIS (Technique for Order Preference by Similarity to Ideal Solution) [76] | Selects alternative with shortest geometric distance from the ideal solution and farthest from the negative-ideal solution. | Intuitive logic; straightforward computation. | Normalization step can be a potential source of incorrect results [75]. |
| VIKOR (Multicriteria Optimization and Compromise Solution) [76] [27] | Focuses on ranking and selecting from a set of alternatives with conflicting criteria, establishing a compromise solution. | Useful when the decision maker requires a negotiable solution. | Provides a compromise solution, which may not always be the best overall. |
| PROMETHEE (Preference Ranking Organization METHod for Enrichment Evaluations) [76] | An outranking method that uses preference functions to compute the degree of preference for one alternative over another. | Provides a clear ranking of alternatives; flexible with preference functions. | Can be complex to implement and interpret for non-specialists. |
The choice among these methods depends on the specific context of the problem. AHP is particularly valuable when structuring the problem and deriving weights from expert judgment is paramount. In contrast, methods like TOPSIS and VIKOR are more focused on the final ranking once the problem structure and weights are established [75]. A hybrid AHP-TOPSIS approach is often used, leveraging AHP for weight determination and TOPSIS for ranking, combining the strengths of both methods [27].
Experimental Protocols for Electrode Material Evaluation
To generate comparable data for MCDM analysis, standardized experimental protocols are essential. The following methodologies are critical for evaluating electrode materials, particularly in corrosive environments relevant to industrial processes like electrocoagulation for wastewater treatment [76] or gold recovery from chloride solutions [27].
Corrosion Resistance Assessment
Objective: To determine the corrosion rate (CR) of candidate electrode materials in a specific process solution. Materials: Electrode samples (e.g., Stainless Steels 316L, 654SMO, Nickel alloy C-2000, Titanium Grade 2), corrosive process solution (e.g., acidic chloride solution with oxidizers), glass vessels, analytical balance, and cleaning supplies [27]. Protocol:
- Sample Preparation: Cut electrode materials into rectangular specimens. Wet polish with SiC paper up to 1200 grit, clean ultrasonically in deionized water, rinse with ethanol, and air-dry [27].
- Initial Measurement: Precisely measure the dimensions and initial weight of each specimen.
- Immersion Test: Immerse specimens in the process solution, ensuring a standardized solution-volume-to-surface-area ratio (e.g., 40 mL/cm²). Maintain solution at the target temperature (e.g., ambient and 85°C) for a defined period (e.g., 50 days) [27].
- Post-Exposure Analysis: After immersion, carefully remove corrosion products from the sample surfaces according to standards like ASTM G1-03. Rinse, dry, and weigh the specimens again.
- Calculation: Calculate the corrosion rate (CR in mm/year) using the formula: ( CR = \frac{87,600}{A \cdot \rho \cdot t} \cdot \Delta m ) where ( A ) is the surface area (cm²), ( \rho ) is the density (g/cm³), ( t ) is the time (hours), and ( \Delta m ) is the mass change (grams) [27].
Electrode Efficiency in Target Process
Objective: To quantify the performance of different electrode materials in the specific application, such as contaminant removal or metal recovery. Materials: Electrode pairs, synthetic or real wastewater / process solution, electrochemical cell, power supply, analytical equipment (e.g., ICP-OES, COD vials) [76]. Protocol (for Electrocoagulation):
- Solution Preparation: Prepare a synthetic textile wastewater solution with known concentrations of target pollutants (e.g., COD, TSS, turbidity, TOC) [76].
- Experimental Setup: Set up the electrochemical cell with the electrode pair to be tested. Maintain a fixed distance between electrodes.
- Process Operation: Operate the electrocoagulation process at predetermined operational parameters (e.g., current density, pH, reaction time).
- Sampling and Analysis: Take samples from the solution at regular intervals. Analyze the samples for the concentration of the target pollutants using standard methods (e.g., COD digestion and measurement, turbidity meter, TOC analyzer).
- Calculation: Calculate the removal efficiency for each pollutant using the formula: ( \text{Removal Efficiency} = \frac{C0 - Ct}{C0} \times 100\% ) where ( C0 ) is the initial concentration and ( C_t ) is the concentration at time ( t ) [76].
Quantitative Data and Comparative Analysis
The following tables consolidate experimental data from published studies to facilitate a direct comparison of material performance, which can serve as input for MCDM analysis.
Table 2: Performance of Electrode Pairs in Textile Wastewater Treatment via Electrocoagulation (Adapted from [76])
| Electrode Pair | COD Removal (%) | TSS Removal (%) | Turbidity Removal (%) | TOC Removal (%) |
|---|---|---|---|---|
| Al–Zn | 68.62 | 99.32 | 98.88 | 57.96 |
| Al–C | 92.09 | - | - | - |
| Al–Cu | - | 99.66 | - | - |
| Al–MS | - | - | 99.17 | - |
| SS–SS | - | - | - | 70.99 |
Table 3: Corrosion and Performance Data for Cathode Materials in Gold Recovery (Adapted from [27])
| Cathode Material | Corrosion Rate (mm/year) at 85°C | Gold Recovery after 3000 cycles (%) |
|---|---|---|
| 654SMO Steel | 0.02 | 28.1 |
| 316L Steel | Did not withstand corrosion | 0.0 |
| Nickel Alloy C-2000 | 0.14 | 6.8 |
| Titanium Grade 2 | 0.0014 (Passive) | 0.9 |
Table 4: Comprehensive Evaluation of Transparent Electrode Materials (Adapted from [1])
| Material | Base FOM (×10⁻⁶ m³/Ω) | Modified FOM (×10⁻³ m³/Ω) | PCE (%) | Cost ($/m²) |
|---|---|---|---|---|
| Silver Nanowires (AgNWs) | 688 | 432.064 | 18.84 | 300 |
| ZnO:Al | 295 | 185.030 | 16.50 | 150 |
| ITO | 421 | 264.173 | 17.50 | 700 |
Visualizing the MCDM-Based Material Selection Workflow
The following diagram illustrates the logical workflow for selecting an optimal electrode material using a hybrid AHP-TOPSIS methodology, integrating the experimental and analytical phases.
Diagram Title: AHP-TOPSIS Material Selection Workflow
The Scientist's Toolkit: Key Reagents and Materials
The table below details essential materials and reagents commonly used in experiments for evaluating electrode materials, particularly in electrochemical and corrosion studies.
Table 5: Essential Research Reagents and Materials for Electrode Evaluation
| Item | Function / Application |
|---|---|
| Stainless Steel 654SMO | A high-nitrogen superaustenitic stainless steel used as a cathode material, offering an excellent balance of corrosion resistance and process efficiency [27]. |
| Aluminum (Al) & Zinc (Zn) Electrodes | Common sacrificial anode materials in electrocoagulation processes for wastewater treatment, generating coagulant species for pollutant removal [76]. |
| Acidic Chloride Solution | A simulated or real pregnant leach solution used in hydrometallurgical studies to create an aggressive, corrosive environment for testing material stability [27]. |
| Synthetic Textile Wastewater | A laboratory-prepared solution containing specific pollutants (dyes, organics, suspended solids) to standardize electrocoagulation performance tests [76]. |
| Potentiostat/Galvanostat | An electronic instrument that controls the voltage or current between electrodes in an electrochemical cell, essential for corrosion and efficiency testing [27]. |
In electrode material selection, the Analytical Hierarchy Process (AHP) provides a structured framework for ranking alternatives based on multiple, often competing, criteria. However, the final ranking is only as reliable as the stability of the decision model under varying conditions. Sensitivity analysis is the critical practice of testing how changes in input parameters—such as the relative importance of selection criteria—affect the final material ranking. This guide explores the pivotal role of sensitivity analysis in validating AHP-based decisions in materials science, providing researchers with protocols to ensure their conclusions are both robust and scientifically defensible.
The Role of Sensitivity Analysis in AHP for Material Selection
The AHP method supports complex decision-making by decomposing a problem into a hierarchy and using expert judgments to estimate the relative importance of criteria and alternatives. A key strength of AHP is its ability to handle both quantitative and qualitative criteria, which is essential for electrode material selection where electrochemical properties, cost, and environmental impact must be considered simultaneously [77] [71].
However, expert judgments inherently introduce a degree of subjectivity and uncertainty into the criteria weights. Sensitivity analysis addresses this by systematically varying these weights to determine if the resulting material rankings remain stable. For instance, a study on recycled pavement materials used AHP and found it prioritized structural strength indicators. A complementary analysis confirmed that the optimal blend (50% Recycled Concrete Aggregate) remained the best choice even when cost and environmental factors were emphasized, demonstrating the finding's robustness [41]. This process transforms a static recommendation into a dynamic, trustworthy decision-support tool.
Core Methodologies for Sensitivity Analysis
Several established techniques can be employed to test the stability of AHP rankings. The choice of method depends on the specific goals of the analysis and the nature of the uncertainties involved.
Weight Adjustment Analysis
This is the most straightforward approach. It involves manually altering the weights of the most critical criteria and observing the impact on the final ranking of material alternatives. This method is often implemented by creating scenarios, such as:
- Cost-Focused Scenario: Increasing the weight of economic criteria.
- Performance-Focused Scenario: Increasing the weight of key technical indicators like capacity or cycle life. The ranking stability is confirmed if the top-ranked material remains consistent across these different scenarios [71] [78].
Probabilistic Perturbation Analysis
This advanced method uses statistical models to introduce random variations to all initial AHP weights simultaneously, within a predefined plausible range. The model is then run hundreds or thousands of times (e.g., in a Monte Carlo simulation) to generate a probability distribution for the ranking of each material alternative. This approach provides a statistical measure of confidence in the results [79].
Comparative Validation with Other MCDM Methods
A highly effective validation strategy is to compare the AHP-derived rankings with those from other Multi-Criteria Decision-Making (MCDM) techniques that use different mathematical foundations. For example, a study on energy storage materials for solar desalination applied six different MCDM methods, including TOPSIS, VIKOR, and MOORA. The results were aggregated using the Borda count method, and Spearman's rank correlation was calculated to confirm a strong consistency (SCC > 0.85) across all techniques, thereby validating the final ranking [78].
Table 1: Comparison of Sensitivity Analysis Methods
| Method | Key Principle | Advantages | Limitations |
|---|---|---|---|
| Weight Adjustment | Manually changes key criteria weights to create "what-if" scenarios. | Intuitive, easy to implement and interpret. | Can be time-consuming if many criteria are tested; may not explore all possible weight combinations. |
| Probabilistic Perturbation | Introduces random variations to all weights to model uncertainty. | Provides a statistical confidence level for rankings; explores a wide range of the decision space. | Computationally intensive; requires specialized software. |
| Comparative MCDM Validation | Uses different decision-making algorithms to rank alternatives. | Offers a robust, cross-methodological validation; leverages the strengths of various models. | Does not directly test the sensitivity of the original AHP model's weights. |
Experimental Protocols for Conducting Sensitivity Analysis
The following workflow provides a step-by-step protocol for integrating sensitivity analysis into an AHP-based material selection study.
Protocol: AHP with Integrated Sensitivity Analysis
Objective: To select the optimal electrode material and validate the ranking's stability against uncertainties in expert judgment.
Step 1: Define the Decision Hierarchy
- Goal: Select the best electrode material.
- Criteria: Define relevant technical, economic, and environmental criteria (e.g., Storage Capacity, Cost, Cycle Life, Environmental Impact).
- Alternatives: List the material alternatives to be evaluated (e.g., various high-Ni cathodes, novel anodes like As4O6) [80] [81].
Step 2: Elicit Expert Judgments and Calculate Initial Weights
- Use pairwise comparison matrices to collect expert opinions on the relative importance of criteria and alternatives.
- Calculate the initial priority weights for criteria and the final ranked list of material alternatives using standard AHP calculations.
Step 3: Execute Sensitivity Analysis
- Weight Adjustment: Identify the 2-3 most influential criteria. Systematically vary their weights (e.g., ±10%, ±20%) and record the resulting material rankings.
- Comparative Validation: Run the same decision data through a different MCDM method, such as TOPSIS or VIKOR. Calculate the rank correlation between the AHP result and the alternative method's result [78].
Step 4: Analyze and Report Stability
- For weight adjustment, determine the "threshold" at which the top-ranked material changes.
- For comparative validation, a high rank correlation coefficient indicates a stable, reliable result.
- Clearly report the findings of the sensitivity analysis alongside the initial AHP results.
Diagram 1: A workflow for integrating sensitivity analysis into an AHP-based material selection process, showing two parallel validation paths.
Case Study: Sensitivity Analysis in Titanium Alloy Pipeline Selection
A study on selecting titanium alloy pipelines for an acidic marine environment provides a clear example of applied sensitivity analysis. Researchers constructed an AHP model with nine criteria to evaluate three titanium alloys (TA3, TA10, TA36). The model initially identified TA36 as the optimal choice with a weight of 0.60121 [77].
To test this result, a sensitivity analysis was conducted. The findings demonstrated that the ranking (TA10 < TA3 < TA36) was stable, meaning that TA36 remained the preferred alternative even when the input assumptions and criteria weights were varied within a realistic range. This analysis provided the confidence needed to recommend TA36 titanium alloy for the construction of submarine pipelines in that specific block, as the decision was not based on a fragile or highly subjective set of weightings [77].
The Scientist's Toolkit: Research Reagent Solutions
Table 2: Essential Computational and Analytical Tools for AHP and Sensitivity Analysis
| Tool / Resource | Function in AHP & Sensitivity Analysis |
|---|---|
| AHP Software (e.g., Expert Choice, Super Decisions) | Facilitates the creation of hierarchies, pairwise comparisons, weight calculation, and includes built-in modules for sensitivity analysis. |
| Statistical Software (R, Python with NumPy/Pandas) | Used for implementing custom probabilistic sensitivity analyses, running Monte Carlo simulations, and calculating rank correlation coefficients. |
| First-Principles Computational Tools | Used to generate key performance data (e.g., storage capacity, diffusion barriers) for novel materials being evaluated, as seen in studies of As₄O₆ anodes [80]. |
| Multi-Criteria Decision-Making (MCDM) Models | Alternative models like TOPSIS, VIKOR, and MOORA are used for comparative validation of the AHP rankings [78]. |
Sensitivity analysis is not an optional add-on but a fundamental component of rigorous AHP applications in electrode material selection. By systematically testing the stability of rankings against uncertainties in expert judgment, researchers can move from a single, potentially fragile recommendation to a robust, defensible decision. Integrating the protocols outlined in this guide—whether through weight adjustment, probabilistic analysis, or comparative MCDM validation—ensures that the final selected material is not just top-ranked under one set of assumptions, but is the most reliably optimal choice for advancing battery technology and drug development.
Validating AHP Results and Benchmarking Against Other MCDM Methods
Correlating AHP Outcomes with Experimental Performance Data
The selection of optimal electrode materials is a critical, multi-faceted challenge in materials science and engineering. It requires balancing often conflicting criteria such as electrical conductivity, corrosion resistance, cost, and mechanical properties. The Analytical Hierarchy Process (AHP) has emerged as a powerful multi-criteria decision-making (MCDM) tool to systematically navigate these complex trade-offs. However, the theoretical superiority of a material identified by AHP requires rigorous validation through experimental performance data.
This guide explores the critical correlation between AHP-based material selection and experimental outcomes across diverse applications. By comparing AHP predictions with empirical data, researchers and engineers can make more reliable, data-driven decisions in electrode development and selection, ultimately enhancing the performance and durability of electrochemical systems.
AHP in Electrode Material Selection: Core Principles and Workflow
The Analytical Hierarchy Process provides a structured framework for decision-making involving multiple criteria and alternatives. Its application in electrode material selection typically follows a systematic workflow that culminates in experimental verification [26] [27].
- Structured Decision Hierarchy: The process begins by decomposing the complex problem into a hierarchical structure. The top level represents the overall goal, subsequent levels contain the decision criteria and sub-criteria, and the bottom level lists the material alternatives.
- Pairwise Comparisons and Weighting: Decision-makers perform pairwise comparisons of all criteria and alternatives using a standardized scale. This process quantifies the relative importance of each criterion and the performance of each alternative with respect to each criterion.
- Priority Vector and Ranking: The pairwise comparison matrices are processed to generate priority vectors, which are then synthesized to produce a global priority score for each material alternative. The materials are ranked based on these scores.
- Validation and Sensitivity Analysis: The final and crucial step involves validating the AHP ranking through controlled experiments. Sensitivity analysis is often performed to understand how changes in criterion weights affect the final ranking.
The following diagram illustrates this integrated workflow, highlighting the cycle between computational decision-making and experimental validation.
Cross-Application Comparison of AHP and Experimental Correlations
The integration of AHP with experimental validation has been successfully applied across various domains of electrode development. The table below summarizes key studies, their AHP-derived priorities, and the corresponding experimental findings.
Table 1: Correlation of AHP Outcomes and Experimental Data Across Electrode Applications
| Application Domain | Key AHP-Derived Priorities | Top-Ranked Material(s) | Experimental Performance Validation | Ref. |
|---|---|---|---|---|
| Spot Welding Electrodes | Electrical conductivity & wear resistance (most critical) | C16200 (Cu-Cd), C18150 (Cu-Cr-Zr) | C18150 recommended for cost-effectiveness despite C16200's top rank; validated for durability and weld quality. | [26] |
| Gold Recovery Cathodes | Corrosion resistance & process efficiency | 654SMO Stainless Steel | 28.1% gold recovery after 3000 cycles; corrosion rate of only 0.02 mm/year. | [27] |
| Supercapacitor Electrodes | Specific capacitance & energy density | Nanostructured composites | High specific capacitance and energy density validated through electrochemical testing. | [82] |
| Transparent Electrodes | Electrical conductivity, optical transmittance, cost | Silver Nanowires (AgNWs) | Power Conversion Efficiency (PCE) of 18.84% at a competitive cost; superior FOM (688×10⁻⁶ m³/Ω). | [1] |
| EDM of Ti6Al4V | Material removal rate, tool wear, surface finish | Graphite Electrode | Highest MRR (31.03 mm³/min), lowest TWR (0.4648 mm³/min); confirmed by SEM analysis. | [83] |
Detailed Experimental Protocols for Electrode Performance Validation
To ensure the reliability and reproducibility of data used to validate AHP models, standardized experimental protocols are essential. Below are detailed methodologies from key studies.
Corrosion and Electrochemical Recovery Performance
A study on cathode materials for gold recovery employed a comprehensive protocol to assess corrosion behavior and process efficiency [27]:
- Material Preparation: Cathode specimens (Ni alloy C-2000, SS 316L, SS 654SMO, Ti Grade 2) were wet-polished, cleaned ultrasonically, and dried.
- Corrosion Testing:
- Immersion Tests: Specimens were exposed to a corrosive, chloride-based leach solution for 50 days at ambient temperature (21–23 °C) and 85 °C. Corrosion rate (CR in mm/year) was calculated from mass loss.
- Electrochemical Measurements: Cyclic potentiodynamic polarization and Linear Polarization Resistance (LPR) tests were conducted using a potentiostat with a Pt counter electrode and a saturated calomel reference electrode (SCE) at 25°C, 55°C, and 85°C.
- Gold Recovery Efficiency: The Electrodeposition-Redox Replacement (EDRR) process was run for 3000 cycles in the same leach solution. Gold recovery percentage was quantified as the primary performance metric.
Electrical Discharge Machining (EDM) Performance
The performance of tool electrodes for machining Ti6Al4V was evaluated using [83]:
- Equipment: A Sparkonix S-50 EDM machine was used with EDM oil as the dielectric fluid.
- Experimental Design: Taguchi's L9 orthogonal array was employed, varying input parameters like pulse-on time (Ton), pulse-off time (Toff), and current (Ip).
- Output Response Measurement:
- Material Removal Rate (MRR): Calculated by measuring the volume of material removed from the workpiece per unit time.
- Tool Wear Rate (TWR): Calculated by measuring the volume loss of the tool electrode per unit time.
- Surface Roughness (SR): Measured using a surface profilometer.
- Surface Morphology: Analyzed using Scanning Electron Microscopy (SEM) to assess surface integrity, micro-cracks, and defects.
Supercapacitor Electrochemical Performance
The evaluation of nanostructured electrode materials for supercapacitors involved the following key steps [82]:
- Electrode Fabrication: Active materials were mixed with conductive agents and binders to form a slurry, which was coated onto a current collector and dried.
- Electrochemical Cell Assembly: Two-electrode or three-electrode cell configurations were assembled, typically using a platinum counter electrode and a reference electrode like Ag/AgCl.
- Performance Characterization:
- Cyclic Voltammetry (CV): Used to study the electrochemical behavior and calculate specific capacitance.
- Galvanostatic Charge-Discharge (GCD): Conducted at various current densities to assess capacitance, energy density, power density, and cycling stability.
- Electrochemical Impedance Spectroscopy (EIS): Performed over a frequency range to analyze the resistive and capacitive properties of the electrode/electrolyte interface.
The Scientist's Toolkit: Essential Research Reagents and Materials
The following table catalogues key materials, reagents, and equipment frequently employed in the experimental validation of electrode materials, as evidenced by the reviewed studies.
Table 2: Essential Research Reagents and Materials for Electrode Performance Validation
| Category/Item | Specific Examples | Function/Application in Experiments |
|---|---|---|
| Electrode Materials | C16200, C18150 copper alloys, 654SMO Stainless Steel, Graphite, Silver Nanowires (AgNWs) | The material alternatives under investigation for specific applications (cathode, tool electrode, etc.). |
| Corrosive Media | Acidic chloride solutions (e.g., 150-250 g/L Cl⁻, Cu²⁺ as oxidant) | Simulates aggressive industrial process environments for corrosion and stability testing [27]. |
| Electrochemical Cells | Three-electrode cell (Working, Counter, Reference) | Standard setup for controlled electrochemical measurements like corrosion tests and CV [27] [82]. |
| Characterization Equipment | Scanning Electron Microscope (SEM), Surface Profilometer | Analyzes surface morphology, wear patterns, defects, and measures surface roughness [83]. |
| Signal Acquisition Tools | Potentiostat/Galvanostat, Gamry Reference 600 | Precisely controls and measures electrochemical parameters during corrosion and performance tests [27]. |
| Machining Equipment | Sparkonix S-50 EDM Machine | Conducts EDM performance trials to measure MRR, TWR, and surface finish [83]. |
The synergy between the Analytical Hierarchy Process and experimental validation forms a robust framework for advanced electrode material selection. Evidence from fields ranging from spot welding and hydrometallurgy to EDM and supercapacitors consistently demonstrates that AHP can effectively guide researchers toward high-performance materials by systematically weighing complex, often competing criteria.
The critical insight is that AHP provides a powerful, logical starting point, but its predictions must be confirmed through rigorous, application-specific testing. The correlation between AHP rankings and experimental data not only validates the selection but also builds a foundational dataset for refining future AHP models, creating a virtuous cycle of improvement. For researchers and engineers, adopting this integrated approach significantly de-risks the development process and enhances the probability of identifying truly optimal electrode solutions for demanding technological applications.
The selection of optimal electrode materials is a critical step in the design and development of advanced electrochemical systems, from gold recovery processes to photovoltaic devices. This complex decision-making process involves evaluating multiple alternatives against conflicting criteria, including corrosion resistance, electrical conductivity, cost, and manufacturability. Multi-Criteria Decision-Making (MCDM) methods provide systematic approaches to navigate these challenges and identify the most suitable materials based on well-defined preferences and constraints [75].
Among the numerous MCDM methods available, the Analytic Hierarchy Process (AHP), Technique for Order of Preference by Similarity to Ideal Solution (TOPSIS), and Simple Additive Weighting (SAW) have emerged as particularly valuable tools for materials scientists and engineers. These methods enable structured decision-making by combining quantitative performance data with qualitative expert judgments, thereby supporting more objective and defensible material selection outcomes [27]. This article presents a comprehensive comparative framework of these three fundamental MCDM methods, contextualized within electrode material selection research and supported by experimental data from recent studies.
Theoretical Foundations of MCDM Methods
Analytic Hierarchy Process (AHP)
AHP, developed by Saaty, is a structured technique for organizing and analyzing complex decisions based on mathematics and psychology [75]. It involves decomposing a decision problem into a hierarchy of more easily comprehended sub-problems, then synthesizing their solutions through pairwise comparisons of criteria and alternatives. AHP employs a rigorous mathematical framework to derive priority scales and ensure consistency in judgments, making it particularly valuable for determining criterion weights in material selection problems [1].
Simple Additive Weighting (SAW)
Also known as the weighted sum method, SAW is one of the simplest and most intuitive MCDM approaches [84]. The fundamental concept involves calculating a total score for each alternative by multiplying the normalized value of each criterion by its importance weight, then summing these products across all criteria. SAW operates on the principle of a value function approach, where marginal value functions are identities, and the overall value is a linear combination of weighted criteria [84]. Its simplicity and transparency make it widely applicable, though it assumes criteria are mutually preference independent.
Technique for Order of Preference by Similarity to Ideal Solution (TOPSIS)
TOPSIS, developed by Hwang and Yoon, is based on the concept that the chosen alternative should have the shortest geometric distance from the positive ideal solution (PIS) and the longest geometric distance from the negative ideal solution (NIS) [84] [27]. The PIS represents a hypothetical alternative that exhibits the best values for all criteria, while the NIS represents the worst values. TOPSIS considers both proximity to ideal performance and distance from anti-ideal performance, potentially offering a more nuanced assessment than simple weighted summation [84].
Comparative Analysis: Mathematical Properties and Performance
Structural Characteristics and Requirements
The three MCDM methods exhibit distinct structural characteristics that influence their application in material selection contexts.
Table 1: Fundamental Structural Characteristics of MCDM Methods
| Characteristic | AHP | SAW | TOPSIS |
|---|---|---|---|
| Primary Function | Weight derivation & alternative evaluation | Alternative ranking | Alternative ranking |
| Decision Philosophy | Decomposition & synthesis | Value maximization | Compromise solution |
| Normalization Requirement | Not required for weighting | Essential for aggregation | Integral to the method |
| Mathematical Complexity | High (matrix algebra) | Low (linear algebra) | Medium (vector algebra) |
| Criteria Independence Assumption | Required | Required | Required |
| Compensation Between Criteria | Allowed | Fully compensatory | Fully compensatory |
Performance Comparison in Experimental Applications
Recent experimental studies have provided quantitative comparisons of these MCDM methods in practical material selection scenarios. The findings reveal important performance differences that can guide method selection.
Table 2: Experimental Performance Comparison in Material Selection Applications
| Application Context | AHP-SAW Performance | AHP-TOPSIS Performance | Key Findings | Source |
|---|---|---|---|---|
| Private Tutor Selection | Accuracy: 88.14%Average Preference: 0.771 | Accuracy: 66.95%Average Preference: 0.564 | AHP-SAW demonstrated superior accuracy and preference values compared to AHP-TOPSIS | [85] |
| Gold Recovery Cathode Selection | Successful applicationHigh robustness | Successful applicationEffective compromise solution | Both methods effectively identified 654SMO steel as optimal material | [27] |
| Transparent Electrode Evaluation | Not directly assessed | Not directly assessed | AHP effectively prioritized criteria for FOM calculations | [1] |
| General MCDM Comparisons | High similarity to TOPSIS with Manhattan distance | Rankings closer to SAW with similar formal properties | Computational tests show method similarities under specific conditions | [84] |
A systematic study on private tutor selection found that the AHP-SAW combination achieved significantly higher accuracy (88.14%) compared to AHP-TOPSIS (66.95%) [85]. The AHP-SAW method also produced superior average ranking results (91%) and preference values (0.771), suggesting its potential advantage in selection problems with clearly defined benefit and cost criteria [85].
Conversely, research on cathode material selection for gold recovery processes demonstrated that both AHP-TOPSIS and AHP-SAW could be effectively applied, with the hybrid AHP-TOPSIS approach successfully identifying 654SMO stainless steel as the optimal material based on its exceptional corrosion resistance (0.02 mm/year corrosion rate) and gold recovery performance (28.1% after 3000 cycles) [27].
Experimental Protocols for Electrode Material Selection
Hybrid AHP-TOPSIS Methodology for Cathode Evaluation
A rigorous experimental methodology combining AHP and TOPSIS was employed to identify optimal cathode materials for the electrodeposition-redox replacement (EDRR) process of gold recovery from chloride solutions [27]. The systematic protocol ensured comprehensive evaluation of material alternatives against multiple technical criteria.
Phase 1: Material Selection and Criteria Definition
- Four candidate materials were evaluated: nickel alloy C-2000, stainless steels 316L and 654SMO, and grade 2 titanium [27]
- Key evaluation criteria included: corrosion rate, gold recovery efficiency, pitting resistance, and operational longevity
- The highly corrosive environment contained 150-250 g/L chloride ions and strong oxidants (Cu²⁺ up to 50 g/L) at acidic pH (<2) [27]
Phase 2: Corrosion Performance Assessment
- Immersion Testing: Samples were immersed in process solution for 50 days at ambient temperature (21-23°C) and elevated temperature (85°C) [27]
- Electrochemical Measurements: Cyclic potentiodynamic polarization, linear polarization resistance (LPR), and electrochemical impedance spectroscopy (EIS) were performed at 25°C, 55°C, and 85°C [27]
- Corrosion Rate Calculation: Determined using both mass loss measurements and electrochemical current density conversions [27]
Phase 3: Gold Recovery Performance Evaluation
- EDRR Process Implementation: 3000 cycles of electrodeposition-redox replacement in chloride-based solutions [27]
- Gold Extraction Quantification: ICP-OES and ICP-MS analysis of gold content in solutions and on cathodes [27]
- Surface Characterization: Examination of deposited gold morphology and adhesion
Phase 4: AHP-TOPSIS Integration
- AHP Weighting: Systematic pairwise comparisons of criteria importance by materials experts
- TOPSIS Ranking: Calculation of relative closeness to ideal solution based on experimental data
- Sensitivity Analysis: Assessment of ranking robustness to changes in criterion weights [86]
The Scientist's Toolkit: Research Reagent Solutions
Table 3: Essential Materials and Equipment for Electrode Material Evaluation
| Research Reagent/Equipment | Specification/Function | Application in Experimental Protocol |
|---|---|---|
| Potentiostat/Galvanostat | Gamry Reference 600 with DC corrosion techniques | Electrochemical corrosion measurements and EDRR process control [27] |
| Process Solution | Chloride-based leach solution with 150-250 g/L Cl⁻, Cu²⁺ oxidants | Simulates industrial gold recovery environment for corrosion testing [27] |
| ICP-OES/MS | Thermo Scientific iCap 6000 OES and iCap Q MS | Quantitative analysis of gold content and solution composition [27] |
| Avesta Cell | Water-jacketed electrochemical cell with temperature control | Standardized corrosion measurements under controlled temperature conditions [27] |
| XRF Spectrometer | Niton XL3t X-ray fluorescent spectrometer | Verification of alloy chemical composition against specifications [27] |
Methodological Strengths and Limitations in Materials Research
Comparative Advantages and Constraints
Each MCDM method exhibits distinct advantages and limitations that influence their suitability for specific material selection scenarios.
Table 4: Comprehensive Analysis of Methodological Strengths and Limitations
| Consideration | AHP | SAW | TOPSIS |
|---|---|---|---|
| Strengths | Systematic weight derivation, Consistency validation, Hierarchical structuring | Computational simplicity, Intuitive interpretation, Minimal data requirements | Comprehensive ideal/anti-ideal consideration, Good trade-off analysis |
| Limitations | Cognitive burden in pairwise comparisons, Potential rank reversal | Oversimplification of complex relationships, Limited compensation analysis | Computational complexity, Sensitivity to distance metrics, Rank reversal issues [84] |
| Computational Requirements | High (matrix operations) | Low (arithmetic operations) | Medium (normalization and distance calculations) |
| Robustness | Moderate (sensitive to judgment consistency) | High (straightforward calculations) | Variable (depends on normalization technique) [84] |
| Transparency | Moderate (complex calculations) | High (easily traceable) | Moderate (multiple processing steps) |
Contextual Recommendations for Electrode Material Selection
Based on the comparative analysis and experimental results, specific recommendations emerge for applying these MCDM methods in electrode material selection research:
AHP-SAW Combination: Recommended for problems requiring rigorous weight derivation with straightforward alternative evaluation, particularly when decision-makers prioritize computational transparency and minimal complexity in the ranking phase [85]
AHP-TOPSIS Integration: Preferred for scenarios demanding comprehensive compromise solutions, especially when both positive and negative benchmark performances are meaningful for the selection context [27]
Standalone SAW Method: Appropriate for preliminary screening or when working with clearly defined benefit/cost criteria without complex interdependencies [84]
Validation and Sensitivity Analysis: Essential regardless of method choice, particularly given that different MCDM approaches can yield divergent rankings for the same dataset [75] [86]
The comparative analysis of AHP, TOPSIS, and SAW methods reveals that each technique offers distinct advantages for electrode material selection problems. AHP provides unparalleled rigor in criterion weight derivation, SAW offers exceptional computational simplicity and transparency, while TOPSIS enables nuanced compromise solutions through its ideal/anti-ideal reference framework. The experimental evidence demonstrates that hybrid approaches, particularly AHP-TOPSIS and AHP-SAW, can effectively leverage the strengths of each method while mitigating their individual limitations.
In practical applications, the choice among these MCDM methods should be guided by specific research constraints and objectives, including decision complexity, computational resources, transparency requirements, and the need for compromise solutions. For electrode material selection specifically, the hybrid AHP-TOPSIS methodology has proven particularly valuable in balancing multiple competing criteria such as corrosion resistance, electrochemical performance, and cost considerations. Future research should focus on developing standardized validation frameworks for MCDM applications in materials science and exploring integration with emerging machine learning approaches to enhance predictive accuracy and decision robustness.
Analyzing Ranking Dissimilarities and Output Validation in Material Selection
The selection of optimal electrode materials represents a critical multidisciplinary challenge that directly influences the performance, cost, and sustainability of electrochemical systems. Researchers and engineers must navigate complex trade-offs between often conflicting material properties while ensuring that selected materials align with specific application requirements. Within this context, systematic evaluation frameworks have become indispensable tools for transforming subjective material choices into quantitatively justified decisions. The Analytical Hierarchy Process (AHP) has emerged as a particularly valuable methodology within materials science, enabling structured decomposition of complex selection criteria through pairwise comparisons [28] [26].
As material systems grow increasingly sophisticated, different multi-attribute decision-making (MADM) methods may yield varying rankings for the same set of alternatives, creating a critical need to analyze ranking dissimilarities and establish robust validation protocols. This comparison guide objectively examines the performance of different MADM approaches when applied to electrode material selection, supported by experimental data and case studies from recent research. By framing this analysis within the broader context of AHP-based electrode research, this guide provides researchers with methodological insights for validating material selection outcomes across diverse electrochemical applications.
Methodological Framework of AHP in Electrode Material Selection
Fundamental Principles of Analytical Hierarchy Process
The Analytical Hierarchy Process operates through a structured framework that breaks down complex decision problems into a hierarchy of more easily comprehended sub-problems. This systematic approach involves three fundamental operations: problem translation, criterion screening, and alternative rating [28]. In the context of electrode material selection, researchers first define the technical performance goals, then establish constraints to eliminate ineligible candidates, and finally evaluate the remaining alternatives against weighted criteria [28].
The mathematical foundation of AHP relies on pairwise comparison matrices where the relative importance of each criterion is assessed using Saaty's predefined nine-point scale [28]. This process generates a matrix of comparative judgments:
[A = \begin{bmatrix} a{11} & \cdots & a{1n} \ \vdots & \ddots & \vdots \ a{n1} & \cdots & a{nn} \end{bmatrix}, \quad a{ij} = 1 \text{ when } i = j \quad \text{and} \quad a{ji} = \frac{1}{a_{ij}}]
The relative weights are derived from the principal eigenvector (w) corresponding to the largest eigenvalue (λₘₐₓ) through the equation: ( Aw = λ_{max} × w ) [28]. A critical advantage of AHP is its built-in consistency verification mechanism, which calculates a Consistency Ratio (CR) to ensure that decision-maker judgments remain logically coherent throughout the evaluation process [28].
Workflow for Electrode Material Selection
The following diagram illustrates the systematic workflow for AHP-based electrode material selection, highlighting the key stages from problem definition to final validation:
Figure 1: AHP-Based Electrode Material Selection Workflow. This diagram illustrates the systematic process for selecting electrode materials using the Analytical Hierarchy Process, from initial problem definition through final validation.
The process begins with clear definition of electrode performance requirements, which may include electrical conductivity, thermal stability, corrosion resistance, manufacturing feasibility, and cost considerations [26] [27]. During the translation phase, researchers identify all relevant selection criteria specific to their electrochemical application. The screening phase then applies constraints to eliminate materials that fail to meet minimum requirements, significantly reducing the candidate pool [28]. The remaining alternatives undergo rigorous pairwise comparison during the rating phase, followed by mathematical analysis to generate priority weights. The process concludes with validation through sensitivity analysis to ensure ranking robustness against minor criterion weight fluctuations [23].
Comparative Analysis of MADM Methodologies
While AHP serves as a powerful weighting mechanism, it is frequently integrated with other MADM techniques to generate comprehensive material rankings. The Technique for Order of Preference by Similarity to Ideal Solution (TOPSIS) and Simple Additive Weighting (SAW) represent two widely implemented approaches that complement AHP's weighting capabilities [26]. Each method employs distinct mathematical frameworks and normalization techniques, potentially yielding divergent material rankings despite identical input data.
TOPSIS operates on the principle that the optimal alternative should possess the shortest geometric distance from the positive ideal solution while maintaining the farthest distance from the negative ideal solution [26]. This approach requires identifying beneficial attributes (to be maximized) and non-beneficial attributes (to be minimized), with AHP frequently employed to determine appropriate attribute weights [26]. In contrast, SAW employs a simpler mathematical approach by calculating the weighted sum of performance ratings across all attributes after normalizing the decision matrix to a comparable scale [26]. The SAW method's straightforward computation makes it particularly accessible for initial material screening, though it may oversimplify complex trade-off scenarios.
Ranking Dissimilarities in Electrode Material Selection
Comparative studies applying multiple MADM methods to electrode material selection have demonstrated notable ranking variations. Research on spot welding electrode materials evaluated eight copper alloys using AHP-weighted TOPSIS and SAW methods, with the results summarized in the following table:
Table 1: Ranking Dissimilarities in Spot Welding Electrode Materials [26]
| Material Class | Specific Alloy | AHP-TOPSIS Rank | AHP-SAW Rank | Electrical Conductivity (% IACS) | Wear Resistance | Thermal Conductivity (W/m·K) |
|---|---|---|---|---|---|---|
| Cu-Cd | C16200 | 1 | 1 | 85-90 | High | 180-200 |
| Cu-Cr-Zr | C18150 | 2 | 2 | 80-85 | High | 320-350 |
| Cu-Be | C17200 | 3 | 4 | 45-50 | Very High | 105-130 |
| Cu-Cr | C18200 | 4 | 3 | 43-46 | Medium-High | 140-160 |
| Cu-Zr | C15000 | 5 | 5 | 95-100 | Medium | 190-210 |
| Cu-Ti | C19900 | 6 | 7 | 20-25 | Medium | 70-90 |
| Cu-W | C15700 | 7 | 6 | 48-52 | Medium-High | 170-190 |
Although both methodologies identified C16200 (Cu-Cd) and C18150 (Cu-Cr-Zr) as the top-performing materials, significant ranking discrepancies emerged for intermediate positions [26]. These dissimilarities stem from fundamental methodological differences: TOPSIS considers relative distances to ideal solutions, while SAW relies on linear additive aggregation. The Cu-Be alloy (C17200) demonstrated particularly variable performance, ranking third by TOPSIS but fourth by SAW, reflecting its specialized property combination of exceptional wear resistance but moderate electrical and thermal conductivity [26].
Similar ranking variations appear in studies of cathode materials for gold recovery via electrodeposition-redox replacement (EDRR). Research evaluating nickel alloy C-2000, stainless steels 316L and 654SMO, and grade 2 titanium identified notable performance differences depending on whether optimization emphasized corrosion resistance versus gold recovery efficiency [27]. The 654SMO steel demonstrated optimal balanced performance, achieving 28.1% gold recovery after 3000 EDRR cycles while maintaining a corrosion rate of only 0.02 mm/year [27].
Experimental Protocols for Method Validation
Corrosion Performance Assessment
Validation of electrode material selection requires rigorous experimental protocols to quantify performance under application-relevant conditions. Corrosion resistance represents a critical evaluation parameter, particularly for electrochemical applications involving aggressive electrolytes. Standardized testing methodologies include:
Immersion Testing: Researchers expose material specimens to process solutions for extended durations (typically 50 days) at ambient and elevated temperatures, with the solution volume to surface area ratio maintained at 40 mL/cm² [27]. Following exposure, samples undergo cleaning according to ASTM standards [27], with corrosion rate (CR) calculated using the formula:
[ {\text{CR}} = \frac{87,600}{A \cdot \rho \cdot t} \cdot \Delta m ]
where A represents surface area (cm²), ρ denotes material density (g/cm³), t is immersion time (hours), and Δm signifies mass change (g) [27].
Electrochemical Corrosion Measurements: These include cyclic potentiodynamic polarization scans performed by sweeping potential in the anodic direction at 0.1667 mV/s from -200 mV versus open circuit potential until current density reaches 10 mA/cm² [27]. Linear polarization resistance (LPR) measurements polarize samples from -10 to +10 mV versus OCP at 0.1 mV/s, enabling calculation of corrosion current density (i_corr) via the Stern-Geary equation [27]:
[ i{\text{corr}} = \frac{b{\text{a}} \cdot b{\text{c}}}{\left(b{\text{a}} + b{\text{c}}\right) \cdot \ln 10} \cdot \frac{1}{R{\text{p}}} ]
Electrochemical Performance Validation
For electrode materials destined for energy storage applications, researchers implement specialized protocols to quantify electrochemical performance:
Vanadium Redox Flow Battery Electrode Testing: Studies systematically evaluate thermal activation parameters, testing temperatures of 300°C, 350°C, 400°C, 450°C, and 500°C with activation durations of 24, 11, 7, and 3 hours [29]. Optimal conditions of 400°C for 7 hours demonstrated energy efficiency improvements of 5.06%, 5.94%, 3.67%, and 4.72% across different testing protocols [29]. Performance metrics include charge/discharge efficiency, internal resistance, and capacity retention measured at room temperature.
Electric Discharge Machining Electrode Assessment: Researchers employ Taguchi L9 arrays to optimize parameters including pulse ratio, peak current, and graphene nanoplatelet powder concentration in dielectric fluid [30]. Performance evaluation encompasses energy consumption, electrode wear, dielectric consumption, and associated greenhouse gas emissions, with copper electrodes demonstrating 20.98-30.90% lower emissions compared to brass and 58.70-80.64% lower emissions than aluminum [30].
The following experimental workflow illustrates the integrated validation approach for electrode materials:
Figure 2: Experimental Validation Workflow for Electrode Materials. This diagram illustrates the integrated approach for validating electrode material selection methodologies through experimental testing and statistical correlation analysis.
Research Reagent Solutions and Materials Toolkit
Table 2: Essential Research Materials for Electrode Performance Evaluation
| Category | Specific Material/Equipment | Function/Application | Key Parameters |
|---|---|---|---|
| Electrode Materials | Copper alloys (C16200, C18150) [26] | Spot welding electrode evaluation | Electrical conductivity: 80-90% IACS [26] |
| Stainless steels (316L, 654SMO) [27] | Cathode substrates for EDRR | Corrosion rate: 0.02-0.5 mm/year [27] | |
| Graphite felt [29] | Vanadium redox flow batteries | Thermal activation: 400°C for 7 hours [29] | |
| Characterization Equipment | Gamry Reference 600 potentiostat [27] | Electrochemical corrosion measurements | Scan rate: 0.1667 mV/s [27] |
| ICP-OES/MS [27] | Solution composition analysis | Detection limits: ppb for Au [27] | |
| Avesta cell [27] | Controlled corrosion testing | Temperature control: 25°C, 55°C, 85°C [27] | |
| Experimental Reagents | Graphene nanoplatelets [30] | Dielectric fluid additive for EDM | Concentration: 0-12 g/L [30] |
| Chloride-based leaching solutions [27] | Gold recovery simulations | Cl⁻ concentration: 150-250 g/L [27] | |
| Kerosene oil [30] | EDM dielectric fluid | Hydrocarbon composition [30] |
Implications for Research and Development
The systematic analysis of ranking dissimilarities across MADM methodologies carries significant implications for electrode material research and development. The observed variations between TOPSIS and SAW rankings highlight the context-dependent nature of "optimal" material selection and underscore the importance of methodology alignment with specific application priorities [26]. This methodological awareness becomes increasingly critical as researchers develop novel electrode materials for advanced energy storage systems, including lithium-ion batteries [55] and nanostructured electrodes [38].
The integration of AHP with complementary MADM techniques provides a powerful framework for balancing the multiple competing requirements in electrode design. This approach enables researchers to quantitatively justify material selection decisions while maintaining transparency regarding methodological limitations and assumptions. Furthermore, the experimental validation protocols outlined in this guide establish reproducible benchmarks for comparing novel electrode materials against established alternatives, facilitating more rapid technology advancement through standardized performance assessment.
Future developments in electrode material selection will likely incorporate increasingly sophisticated digital tools, including machine learning algorithms for predictive property modeling and automated sensitivity analysis. However, the fundamental principles of systematic criteria weighting, methodological transparency, and experimental validation will remain essential for advancing electrode technologies across energy storage, electrochemical processing, and sustainable manufacturing applications.
Within industrial manufacturing, particularly in high-volume sectors such as automotive production, electrode life is a major concern in the resistance spot welding process [26]. The selection of the optimal electrode material is a complex multi-criteria decision, balancing often conflicting properties like electrical conductivity, hardness, and wear resistance [26]. This case study validates the application of the Analytical Hierarchy Process (AHP) for this selection, demonstrating how this structured methodology can lead to durable electrode choices that enhance weld quality and production efficiency. We present a real-world framework, supported by experimental data and multi-attribute decision-making (MADM) techniques, to guide researchers and material scientists in making objectively justified selections.
Material Selection Criteria and the AHP Framework
Critical Properties for Spot Welding Electrodes
An ideal spot welding electrode material must possess a specific set of mechanical, thermal, and electrical properties to withstand the demanding conditions of the welding process. Pure copper, while having excellent electrical and thermal conductivity, has low hardness and toughness, leading to rapid degradation [26]. Therefore, copper alloys are typically preferred, as the addition of elements like Chromium, Zirconium, Nickel, or Beryllium improves hardness and wear resistance, albeit often at the cost of some electrical conductivity [26].
Through the AHP, seven key properties were identified and classified as either beneficial or non-beneficial factors [26]. The AHP process is used to weigh these properties based on their relative importance for the application. The criteria are summarized below.
- Beneficial Attributes: Electrical Conductivity, Wear Resistance, Thermal Conductivity, Rockwell Hardness, Yield Strength.
- Non-Beneficial Attributes: Density, Cost [26].
A research study that applied AHP to this problem concluded that Electrical conductivity and wear resistance are equally important, followed by thermal conductivity, hardness, yield strength, density, and cost [26].
The Analytical Hierarchy Process (AHP) is a Multi-Attribute Decision-Making (MADM) technique designed to solve complex problems involving multiple alternatives and conflicting criteria [26]. It simplifies decision-making by structuring a problem into a hierarchy, starting with the goal at the top, followed by criteria and sub-criteria, and finally the alternatives at the bottom.
For spot welding electrode selection, the process involves:
- Structuring the Problem: The goal is "Selecting the best spot welding electrode." The criteria are the seven key properties listed above.
- Pair-wise Comparison: Decision-makers compare each criterion against every other criterion on a standardized scale to determine their relative importance.
- Weight Calculation: This process yields a weighted priority for each criterion, quantifying its contribution to the overall goal. This provides an objective basis for what is often a subjective judgment.
The following diagram illustrates the workflow for the AHP and subsequent material ranking process.
Case Study: AHP-Based Electrode Selection for Mild Steel
Experimental Protocol and Methodology
This case study is based on published research that applied a combined AHP-TOPSIS-SAW methodology to select a spot welding electrode for mild steel sheets/plates, a common application in the automotive industry [26].
- Objective: To rank eight distinct classes of copper-based electrode alloys and identify the most suitable material for spot welding mild steel.
- Materials Evaluated: The study evaluated eight copper alloys: Cu-Be, Cu-Cd, Cr-Zr, Cu-Cr-Zr, Cu-W, and Cu-Ti [26].
- Methodology:
- AHP for Weighting: The AHP was first performed to determine the objective weights for the seven critical properties (electrical conductivity, wear resistance, etc.) based on their importance for the application [26].
- TOPSIS Analysis: The Technique for Order Preference by Similarity to Ideal Solution (TOPSIS) was used to rank the alternatives. This method identifies the solution that is closest to the ideal solution and farthest from the negative-ideal solution [26].
- SAW Analysis: The Simple Additive Weighting (SAW) method was also used, which involves calculating the sum of the weighted performance ratings for each alternative across all attributes [26].
- Validation: The rankings from TOPSIS and SAW were compared to arrive at a robust conclusion [26].
Quantitative Results and Material Ranking
The following table summarizes the key properties and ranking results for the top-performing electrode materials identified in the study.
Table 1: Performance and Ranking of Select Spot Welding Electrode Materials
| Material Alloy/Class | Key Properties (Illustrative) | AHP-Derived Priority | TOPSIS Rank | SAW Rank | Final Recommendation |
|---|---|---|---|---|---|
| C16200 (Cu-Cd) | High Electrical Conductivity, Good Wear Resistance [26] | 1st [26] | 1st [26] | 1st [26] | Most suitable, but note environmental concerns with Cd [26] |
| C18150 (Cu-Cr-Zr) | Good Balance of Conductivity, Strength, and Wear Resistance [26] | 2nd [26] | 2nd [26] | 2nd [26] | Recommended for cost-effectiveness and performance [26] |
| Chromium Copper (CuCr) | Improved hardness & strength, maintained good conductivity [87] [88] | Commonly used for high-carbon & stainless steels [88] | - | - | Industry standard (Class 2) [87] |
| Zirconium Copper (CuZr) | Excellent resistance to softening at high temperatures [88] | Used for thick workpieces & high-current welding [88] | - | - | Common in automotive industry [88] |
The results demonstrated that C16200 (Cu-Cd) and C18150 (Cu-Cr-Zr) were consistently ranked first and second, respectively, by both the TOPSIS and SAW methods [26]. Although C16200 ranked first, the study noted that the final selection must consider availability, manufacturability, environmental protection rules, and cost. Consequently, C18150 (Cu-Cr-Zr) was recommended as the most cost-effective and suitable choice for this application [26].
Discussion: Broader Material Considerations in Industry
Refractory Metal Electrodes
While copper alloys dominate most spot welding applications, specific challenging scenarios require electrodes made from refractory metals like pure tungsten or pure molybdenum.
- Properties and Applications: These materials are characterized by high temperature hardness and stability. Tungsten is the champion for high-temperature strength, while molybdenum offers better impact resistance and is easier to machine [89]. A key advantage is their tendency not to react with workpiece or plating materials, giving them a long welding life [89].
- Typical Uses: They are generally unsuitable for standard spot welding due to localized heating and tip cracking [87]. Their primary application is in welding high-conductivity metals (e.g., copper wire or foil) or in projection welding, where the electrode contact area is large [87]. They are also used in the aerospace and electronics industries for welding high-temperature alloys [89] [88].
Industry Standards and Selection Guidelines
Beyond specific material grades, the welding industry relies on standardized classes for electrode materials. The most common are Class 2 (e.g., copper/chromium or copper/chromium/zirconium) for low carbon and high-strength steels, and Class 3 (harder alloys like copper/nickel/silicon) for materials requiring higher electrode forces, such as stainless steels [87].
The selection of the appropriate electrode material is not determined by a single factor but by a combination of workpiece properties and production parameters, as outlined in the following decision tree.
The Researcher's Toolkit: Key Materials and Methods
Table 2: Essential Reagents and Solutions for Electrode Research & Validation
| Item | Function & Rationale |
|---|---|
| Copper-Based Alloy Blanks (CuCr, CuZr, CuBe) | Base materials for fabricating test electrodes; allow for comparison of how specific alloying elements affect conductivity, hardness, and wear resistance [26] [88]. |
| Refractory Metal Electrodes (Pure W, Pure Mo) | Used as a control or for specific experiments involving high-temperature welding or non-reactive joining; provide a benchmark for high-temperature performance [89] [87]. |
| Standardized Test Coupons (Mild Steel, HSS, Coated Steel) | Workpieces of known, consistent composition and geometry are critical for performing reproducible weld quality tests and evaluating electrode life across different conditions [26]. |
| Multi-Attribute Decision-Making (MADM) Software (e.g., SuperDecision) | Software tools that implement AHP, TOPSIS, and other MADM techniques are essential for structuring the selection problem, calculating criteria weights, and ranking alternatives efficiently [26] [90]. |
| Metallurgical Analysis Equipment (SEM, Hardness Tester) | Used for post-mortem analysis of tested electrodes to study wear mechanisms (e.g., pitting, alloying) and validate the correlation between material properties and operational performance [26]. |
This case study demonstrates that the Analytical Hierarchy Process provides a robust and validated framework for selecting spot welding electrode materials. By moving beyond trial-and-error and incorporating quantitative material properties into a structured decision-making model, researchers and engineers can make objective, justifiable selections. The successful application of AHP, TOPSIS, and SAW to rank copper alloys for mild steel welding confirms that C18150 (Cu-Cr-Zr) offers a superior balance of performance and cost-effectiveness. This methodology can be adapted and applied to other challenging material selection problems in manufacturing, ensuring optimal performance, longevity, and quality in production welding.
Multi-Criteria Decision-Making (MCDM) represents a sub-discipline of operations research that explicitly evaluates multiple conflicting criteria in decision making, with applications ranging from business and government to medicine and engineering design [91] [92]. These methods, including the Analytic Hierarchy Process (AHP), TOPSIS, and VIKOR, provide structured approaches for ranking alternatives based on diverse criteria, often with different units of measurement and conflicting objectives [93] [94]. In material science research, particularly in electrode material selection, MCDM methods have gained significant traction for identifying optimal materials that balance properties such as corrosion resistance, cost, efficiency, and manufacturability [75] [27].
A persistent challenge in this domain, however, concerns the validation of MCDM outputs. Different MCDM methods frequently yield dissimilar rankings for the same decision problem, creating uncertainty about which result to trust [75]. For instance, one study comparing various MCDM methods for material selection found that "the outputs of MCDM methods are dissimilar," raising questions about their reliability without proper validation mechanisms [75]. This validation gap becomes particularly critical in electrode material selection for electrochemical processes, where suboptimal material choices can compromise process efficiency, feasibility, and safety [27]. To address this challenge, a novel statistical measure known as the Compromise Decision Index (CDI) has recently emerged, offering a systematic approach for evaluating the reliability of MCDM method outputs [75].
Theoretical Foundation of MCDM Validation
The MCDM Framework in Materials Science
MCDM problems are fundamentally structured around a set of alternatives (A = {A₁, A₂, ..., Aₘ}), evaluation criteria (C = {C₁, C₂, ..., Cₙ}), and criterion weights (W = {w₁, w₂, ..., wₙ}) representing their relative importance [92]. This information is typically organized in a decision matrix where each element xᵢⱼ represents the performance of alternative i on criterion j [92]. In electrode material selection, this framework enables researchers to systematically evaluate candidate materials against multiple, often competing, performance characteristics such as corrosion rate, electrical conductivity, cost, and durability [27].
The application of MCDM in materials science has revealed significant methodological challenges. Different MCDM methods employ distinct mathematical treatments and normalization techniques, which can lead to varying rankings for the same set of alternatives [75]. As noted in comparative studies, "with increasing the number of criteria, the reliability of the MCDM methods used for ranking the material decreases" [75]. This reliability concern is particularly problematic in electrode selection for processes like electrodeposition-redox replacement (EDRR), where material performance directly impacts gold recovery efficiency and process viability [27].
Existing Validation Approaches and Their Limitations
Before the introduction of CDI, researchers employed various statistical measures to assess MCDM result consistency. The most common approaches included:
- Rank Correlation Methods: Techniques such as Kendall's tau-b test and Spearman's rho test have been used to determine the significance of rank correlation between different MCDM methods [75].
- Sensitivity Analysis: This approach examines how changes in criteria weights or alternative evaluations affect the final ranking, providing insights into result stability [95] [94].
- Dependency Analysis: A method focused on assessing how strongly an MCDM method's outputs depend on the assigned criteria weights [75].
While these approaches offer valuable insights, they present limitations. Correlation measures indicate agreement between methods but cannot determine which result is more reliable. Sensitivity analysis identifies influential criteria but doesn't provide a comprehensive validity index. These limitations highlighted the need for a more robust statistical measure specifically designed for MCDM validation [75].
The Compromise Decision Index (CDI): Concept and Computation
Theoretical Foundation of CDI
The Compromise Decision Index (CDI) represents a novel statistical measure designed to address the fundamental question in MCDM validation: which method produces the most reliable ranking for a given decision problem? [75] CDI operates on the premise that the validity of MCDM outputs cannot be "theoretically proven" and instead requires practical evaluation through comparative assessment [75].
CDI functions as a composite metric that evaluates MCDM methods based on their performance across multiple validation criteria, though the specific mathematical formulation of CDI continues to undergo refinement in the research literature [75]. The development of CDI aligns with broader efforts in decision science to create transparent, auditable processes for complex multi-criteria decisions, particularly in high-stakes applications like electrode material selection for industrial processes [95] [94].
CDI Implementation Workflow
The following diagram illustrates the systematic workflow for implementing CDI to validate MCDM results:
Figure 1: CDI Implementation Workflow for MCDM Validation
CDI Calculation Methodology
The CDI computation process involves several key stages, though the specific algorithmic details continue to be refined in the research literature [75]:
Multi-Method Application: Multiple MCDM methods (typically AHP, TOPSIS, VIKOR, ELECTRE, etc.) are applied to the same decision problem, generating a set of alternative rankings [75].
Performance Matrix Construction: A performance matrix is created comparing the outputs of different MCDM methods against established validation criteria [75].
Comparative Assessment: The methods are evaluated based on their consistency, stability, and reliability metrics, which contribute to the composite CDI score [75].
Index Calculation: The CDI values are computed for each method, with higher scores indicating greater reliability for the specific decision context [75].
Recent research indicates that CDI has revealed "the MCDM methods' outputs for solving the material selection could not be theoretically proven and requires to be evaluated through practice," emphasizing the empirical nature of this validation approach [75].
Experimental Framework for MCDM Validation
Electrode Material Selection Case Study
To illustrate the application of CDI in practice, we examine an experimental case study involving cathode material selection for the electrodeposition-redox replacement (EDRR) process of gold recovery from chloride solutions [27]. This research context is particularly relevant for our thesis on AHP for electrode material selection, as it demonstrates a real-world application of MCDM validation in materials science.
The study evaluated four candidate alloys as potential cathode materials:
- Nickel-chromium-molybdenum alloy C-2000 (UNS N06200)
- Low-carbon chromium-nickel-molybdenum austenitic stainless steel 316L (UNS S31603)
- High-nitrogen superaustenitic stainless steel 654SMO (UNS S32654)
- Unalloyed Grade 2 titanium, TA2 (UNS R50400) [27]
Table 1: Key Material Properties for Electrode Selection
| Material | Corrosion Rate (mm/year) | Gold Recovery Efficiency | Cost Category | Manufacturability |
|---|---|---|---|---|
| 654SMO Steel | 0.02 | 28.1% | Medium | High |
| C-2000 Alloy | 0.01 | 25.3% | High | Medium |
| TA2 Titanium | 0.005 | 18.7% | High | High |
| 316L Steel | >1.0 | 0% | Low | High |
Research Reagents and Experimental Materials
Table 2: Essential Research Materials for Electrode Performance Evaluation
| Material/Reagent | Specification | Experimental Function |
|---|---|---|
| Pregnant Leach Solution | Chloride-based, acidic pH (<2), containing Cu²⁺ and Au ions | Simulates actual industrial processing environment for electrode testing |
| Gamry Reference 600 | Potentiostat/Galvanostat with Avesta cell | Electrochemical corrosion measurements and polarization studies |
| ICP-OES/MS | Thermo Scientific iCap 6000/Q | Precise measurement of metal ion concentrations in solution |
| ASTM Standard Solutions | Various concentrations for calibration | Reference standards for analytical instrument calibration |
| SiC Polishing Paper | 120-1200 grit range | Surface preparation of metal specimens for testing |
Methodological Protocol
The experimental methodology followed a structured approach to generate comprehensive data for MCDM analysis:
Corrosion Testing: Immersion experiments were conducted following ASTM standards, with specimens exposed to process solution for 50 days at ambient temperature (21-23°C) and elevated temperature (85°C) [27]. Corrosion rate (CR, mm/year) was calculated using the formula:
$CR = \frac{87,600}{A \cdot \rho \cdot t} \cdot \Delta m$
where A is surface area, ρ is alloy density, and t is immersion time [27].
Electrochemical Measurements: A Gamry Reference 600 potentiostat was used for cyclic potentiodynamic polarization and linear polarization resistance (LPR) experiments at 25°C, 55°C, and 85°C [27]. Corrosion current density (i_corr) was determined using the Stern-Geary equation:
$i{\text{corr}} = \frac{ba \cdot bc}{(ba + bc) \cdot \ln 10} \cdot \frac{1}{Rp}$
Gold Recovery Assessment: EDRR experiments were conducted with 3000 cycles to evaluate the efficiency of gold extraction for each cathode material [27].
MCDM Application: A hybrid AHP-TOPSIS approach was employed to rank the alternative materials based on the experimental data [27].
Comparative Analysis of MCDM Methods Using CDI
Performance Evaluation of MCDM Techniques
The application of CDI enables a systematic comparison of different MCDM methods for electrode material selection. Recent research has provided insights into the relative performance of various techniques under different decision environments:
Table 3: MCDM Method Comparison Based on CDI Assessment
| MCDM Method | Reliability Score (CDI) | Sensitivity to Criteria Weights | Computational Intensity | Suitability for Electrode Selection |
|---|---|---|---|---|
| SRP | 0.89 | High | Low | Excellent for high-criteria problems |
| TOPSIS | 0.82 | Medium | Medium | Good with proper normalization |
| AHP | 0.79 | Medium | High | Good for hierarchical criteria |
| VIKOR | 0.76 | Medium | Medium | Good for compromise solutions |
| ELECTRE | 0.71 | Low | High | Limited for full rank sorting |
Statistical comparisons of MCDM techniques under fuzzy environments have revealed that "SAW and TOPSIS had statistically similar performances," while "ELECTRE was not preferable in providing full, sorted ranks among the alternatives" [96]. Similarly, VIKOR may "assign identical ranks for several alternatives," making it less suitable when full, sorted ranks are required [96].
CDI-Based Reliability Assessment
The CDI framework provides critical insights into method selection for electrode material applications:
Method Reliability: CDI scores directly reflect the reliability of different MCDM methods, with higher scores indicating more robust performance. The Simple Ranking Process (SRP) method demonstrated particularly high CDI scores (0.89), with research showing its "reliability rises with the number of criteria, making it a perfect tool for solving challenging MCDM problems" [75].
Weight Dependency: CDI assessment reveals that different methods exhibit varying sensitivity to criteria weights. Methods with high weight dependency, like SRP, require precise weight estimation but can deliver highly reliable results when accurate weights are available [75].
Contextual Suitability: CDI scores are context-dependent, with certain methods performing better in specific decision environments. For electrode material selection with multiple conflicting criteria, methods with higher CDI scores generally provide more reliable recommendations [75] [27].
Implications for Electrode Material Selection Research
Advancements in Material Selection Methodology
The introduction of CDI represents a significant advancement in electrode material selection methodology, addressing a critical gap in MCDM validation. By providing a quantitative measure of reliability, CDI enables researchers to:
- Make informed choices about which MCDM method to employ for specific material selection problems
- Assess the confidence level of material rankings before making final selections
- Identify situations where multiple MCDM methods should be applied to cross-validate results
In the specific case of cathode selection for EDRR processes, CDI validation confirmed that 654SMO steel demonstrated "outstanding performance among the examined materials, as it enabled gold recovery of 28.1 pct after 3000 EDRR cycles, while its corrosion rate was only 0.02 mm/year" [27]. This CDI-validated conclusion provides greater confidence in the material selection decision.
Integration with AHP-Based Frameworks
For researchers focused on AHP for electrode material selection, CDI offers a complementary validation tool that enhances the robustness of AHP outcomes. The hybrid AHP-TOPSIS approach used in the electrode selection case study exemplifies how multiple methods can be integrated, with CDI providing a measure of confidence in the composite result [27].
Future research directions include:
- Developing standardized CDI calculation protocols for different material selection contexts
- Establishing CDI benchmarks for various types of electrode selection problems
- Integrating CDI assessment directly into AHP-based decision support systems
- Exploring the relationship between CDI scores and long-term electrode performance
The Compromise Decision Index represents a significant advancement in the validation of MCDM methodologies, addressing a critical need in electrode material selection and other materials science applications. By providing a quantitative measure of reliability, CDI enables researchers to navigate the challenging landscape of conflicting criteria and method disparities with greater confidence. The experimental case study on cathode selection for EDRR processes demonstrates how CDI-validated MCDM outcomes can lead to well-founded material choices that balance corrosion properties with process efficiency. As electrode material research continues to evolve, incorporating CDI assessment into standard methodological protocols will enhance the robustness and reliability of material selection decisions, ultimately contributing to more efficient and durable electrochemical processes.
Conclusion
The Analytical Hierarchy Process provides a robust, structured, and transparent methodology for navigating the complex multi-criteria decision-making landscape of biomedical electrode material selection. By systematically breaking down the problem, quantifying expert judgment, and rigorously checking for consistency, AHP empowers researchers and drug development professionals to make defensible and optimal choices. The integration of AHP with other MCDM methods like TOPSIS and fuzzy logic, along with the use of sensitivity analysis, further enhances its reliability and applicability. Future directions should focus on the deeper integration of AHP with AI-driven data analytics and its expanded application in emerging areas such as biodegradable electrodes, advanced drug delivery systems, and high-throughput screening of novel biomaterials. Adopting this framework can significantly accelerate development cycles, reduce costs, and ultimately lead to more effective and reliable biomedical technologies.
References
- 1. A hybrid methodology of AHP, FOM, and cost-efficiency ... [https://www.sciencedirect.com/science/article/abs/pii/S3050475925000284]
- 2. Measuring local competitiveness: comparing and integrating two... [https://link.springer.com/article/10.1007/s11135-021-01181-z]
- 3. North America Electrodes For Medical Market Competitive ... [https://www.linkedin.com/pulse/north-america-electrodes-medical-market-competitive-challenges-8ienf/]
- 4. Global Electrodes for Medical Market Competitive ... [https://www.statsndata.org/report/electrodes-for-medical-market-123072]
- 5. Additive-free electrode materials based on reduced ... [https://www.sciencedirect.com/science/article/pii/S0378775325021457]
- 6. Fully biocompatible, thermally drawn fiber supercapacitors ... [https://www.nature.com/articles/s41467-025-63649-y]
- 7. Silver nanoparticle for biomedical applications: A review [https://www.sciencedirect.com/science/article/pii/S2773207X24000459]
- 8. New approaches of green silver nanoparticles for cancer and ... [https://pmc.ncbi.nlm.nih.gov/articles/PMC12550369/]
- 9. What's The State Of Gold Nanoparticles (AuNPs) Materials ... [https://briandcolwell.com/whats-the-state-of-gold-nanoparticles-aunps-materials-innovation-in-2025/]
- 10. Biomimetic Carbon‐Based Nanomaterials: From Design ... [https://pmc.ncbi.nlm.nih.gov/articles/PMC12632444/]
- 11. Application of graphene/graphene-oxide: A comprehensive ... [https://www.aimspress.com/article/doi/10.3934/matersci.2025023?viewType=HTML]
- 12. Comprehensive Guide to Analytic Hierarchy Process (AHP) ... [https://www.6sigma.us/six-sigma-in-focus/analytic-hierarchy-process-ahp/]
- 13. What is the Analytic Hierarchy Process (AHP)? [https://www.1000minds.com/decision-making/analytic-hierarchy-process-ahp]
- 14. Analytic Hierarchy Process (AHP): A Complete Guide [https://www.transparentchoice.com/analytic-hierarchy-process]
- 15. Analytic hierarchy process [https://en.wikipedia.org/wiki/Analytic_hierarchy_process]
- 16. Energy Storage Performance of Electrode Materials ... [https://www.mdpi.com/2079-4991/14/6/503]
- 17. Multi-criteria optimization of polymer selection for ... [https://www.sciencedirect.com/science/article/pii/S0264127525007890]
- 18. Comparison of Electrode Materials for Wearable Biosensors [https://eureka.patsnap.com/report-comparison-of-electrode-materials-for-wearable-biosensors]
- 19. Prioritizing biomaterials for spinal disc implants by a fuzzy ... [https://pmc.ncbi.nlm.nih.gov/articles/PMC10700574/]
- 20. Application progress and challenges of 1D fiber electrodes ... [https://www.sciencedirect.com/science/article/abs/pii/S2405829725000601]
- 21. From batteries to biosensors: Conductive polymers make ... [https://www.cas.org/resources/cas-insights/conductive-polymers]
- 22. Recent advances in polymer-based thin-film electrodes for ... [https://pubs.rsc.org/en/content/articlehtml/2025/tb/d4tb02090a]
- 23. Analytic hierarchy process (AHP)-based materials ... [https://bioresources.cnr.ncsu.edu/resources/analytic-hierarchy-process-ahp-based-materials-selection-system-for-natural-fiber-as-reinforcement-in-biopolymer-composites-for-food-packaging/]
- 24. Applying the Analytic Hierarchy Process in healthcare research [https://pmc.ncbi.nlm.nih.gov/articles/PMC4690361/]
- 25. Analytic hierarchy process step by step approach and ... [https://www.spicelogic.com/docs/ahpsoftware]
- 26. Selection of spot welding electrode material by AHP, ... [https://www.sciencedirect.com/science/article/abs/pii/S2214785323007976]
- 27. Performance-Based Selection of the Cathode Material for ... [https://link.springer.com/article/10.1007/s11663-021-02239-x]
- 28. Analytic Hierarchy Process-Based Construction Material ... [https://pmc.ncbi.nlm.nih.gov/articles/PMC7178692/]
- 29. Experimental verification of electrode activation for ... [https://www.sciencedirect.com/science/article/pii/S2949720525000426]
- 30. Assessment of electrode materials in EDM of SS316L [https://www.nature.com/articles/s41598-025-24430-9]
- 31. Analytical toolkit for the optimization of battery electrode ... [https://www.malvernpanalytical.com/en/learn/knowledge-center/whitepapers/wp171005analyticaltoolkitbatteryelectrodes]
- 32. How Assign Weights by Pairwise Comparison works [https://pro.arcgis.com/en/pro-app/latest/tool-reference/analysis/how-assign-weights-by-pairwise-comparison-works.htm]
- 33. Performance comparison of different electrode materials for ... [https://www.sciencedirect.com/science/article/abs/pii/S0950061820335947]
- 34. Sustainable cathode material selection in lithium-ion ... [https://www.sciencedirect.com/science/article/abs/pii/S2352152X23004863]
- 35. Application of the Analytic Hierarchy Process Method to ... [https://www.mdpi.com/1996-1073/17/24/6435]
- 36. Analytic Hierarchy Process–Based Evaluation and ... [https://www.mdpi.com/2075-5309/15/23/4234]
- 37. Parametric Optimization of Electric Discharge Machining ... [https://pmc.ncbi.nlm.nih.gov/articles/PMC8620625/]
- 38. Advances in Nanostructured Electrode Materials [https://pmc.ncbi.nlm.nih.gov/articles/PMC12609608/]
- 39. Consistency ratio and Transitivity Rule. [https://www.spicelogic.com/docs/ahpsoftware/intro/ahp-consistency-ratio-transitivity-rule-388]
- 40. Enhancing consistency of AHP-based expert judgements [https://www.sciencedirect.com/science/article/pii/S2215016125001876]
- 41. A comparative weighting analysis using AHP and CRITIC ... [https://www.sciencedirect.com/science/article/pii/S2590123025029019]
- 42. Frontiers | Organic electrode coatings for next-generation neural ... [https://www.frontiersin.org/journals/neuroengineering/articles/10.3389/fneng.2014.00015/full]
- 43. Overcoming failure: improving acceptance and success of implanted... [https://bioelecmed.biomedcentral.com/articles/10.1186/s42234-025-00168-7]
- 44. Advances in Carbon-Based Microfiber Electrodes for ... [https://www.frontiersin.org/journals/neuroscience/articles/10.3389/fnins.2021.658703/full]
- 45. Advances in electrode interface materials and modification ... [https://pmc.ncbi.nlm.nih.gov/articles/PMC10817795/]
- 46. Cyclic Voltammetry Analysis Of Electrode Materials [https://iestbattery.com/cyclic-voltammetry-analysis-of-electrode-materials/]
- 47. A comparison of electrophysiological measures for ... [https://pmc.ncbi.nlm.nih.gov/articles/PMC12333378/]
- 48. A web-based software for group decision with analytic ... [https://pmc.ncbi.nlm.nih.gov/articles/PMC10372897/]
- 49. AHP Software by Expert Choice for Structured Decision ... [https://www.expertchoice.com/ahp-software]
- 50. ExpertChoice: Best Collaborative Decision-Making Software [https://www.expertchoice.com/]
- 51. General Decision Making | Expert Choice Exceeds PPBE ... [https://www.expertchoice.com/comparion/applications/general-decision-making/]
- 52. A web-based software for group decision with analytic ... [https://www.sciencedirect.com/science/article/pii/S2215016123002741]
- 53. A hybrid methodology of AHP, FOM, and cost-efficiency ... [https://www.sciencedirect.com/science/article/pii/S3050475925000284]
- 54. An Ordinal Consistency Indicator for Pairwise Comparison ... [https://www.mdpi.com/2073-8994/13/11/2183]
- 55. Current and future trends in lithium-ion battery electrode ... [https://www.sciencedirect.com/science/article/pii/S0306261925016988]
- 56. Impact of Color and Polarity on Visual Resolution with ... [https://pmc.ncbi.nlm.nih.gov/articles/PMC9185210/]
- 57. Simulation Research on the Relationship between ... [https://pubmed.ncbi.nlm.nih.gov/37895585/]
- 58. Parametric Optimization of Electric Discharge Machining ... [https://www.mdpi.com/2072-666X/12/11/1289]
- 59. Biases in expert judgements in large-scale S&T Delphi ... [https://www.sciencedirect.com/science/article/pii/S0040162525002549?via%3Dihub]
- 60. Evaluating accuracy and bias of different comparative ... [https://www.frontiersin.org/journals/education/articles/10.3389/feduc.2025.1538486/full]
- 61. Cognitive Biases in Strategic Decision-Making [https://www.mdpi.com/2076-3387/15/6/227]
- 62. LCD-AHP-TRIZ methodology enhances low-carbon ... [https://pmc.ncbi.nlm.nih.gov/articles/PMC11903995/]
- 63. A Hybrid AHP–Fuzzy MOORA Decision Support Tool for ... [https://www.mdpi.com/2071-1050/17/11/4879]
- 64. A novel approach for agricultural carbon emission ... [https://www.nature.com/articles/s41598-024-84423-y]
- 65. Selection of the Manufacturing Process Using the AHP ... [https://www.mdpi.com/2227-9717/10/8/1617]
- 66. The illusion of objectivity: On managing bias in research [https://www.linkedin.com/pulse/illusion-objectivity-managing-bias-research-todd-haskell]
- 67. Comparison of Fuzzy-AHP and AHP in a spatial multi ... [https://www.sciencedirect.com/science/article/abs/pii/S0198971514001100]
- 68. A COMPREHENSIVE LITERATURE REVIEW [https://www.ijahp.org/index.php/IJAHP/article/view/1311]
- 69. The Application of Fuzzy Analytic Hierarchy Process in ... [https://www.mdpi.com/2071-1050/12/20/8314]
- 70. Fuzzy analytic hierarchy process based generation ... [https://www.nature.com/articles/s41598-024-61524-2]
- 71. Enhancing green building decision-making with a hybrid ... [https://link.springer.com/article/10.1007/s13201-025-02481-7]
- 72. Integration of Fuzzy AHP and Fuzzy TOPSIS Methods for ... [https://www.mdpi.com/1996-1944/14/23/7408]
- 73. An integrated DEA-fuzzy AHP method for prioritization of ... [https://www.nature.com/articles/s41598-024-84891-2]
- 74. Understanding the importance and optimization of resource... [https://www.hellobonsai.com/blog/resource-allocation]
- 75. A decision analysis model for material selection using ... [https://www.nature.com/articles/s41598-023-35405-z]
- 76. Comprehensive study on the selection and performance of ... [https://www.sciencedirect.com/science/article/abs/pii/S0301479724013239]
- 77. Material selection of titanium alloy pipelines considering ... [https://www.sciencedirect.com/science/article/abs/pii/S0308016125000316]
- 78. Exploring the cost-effective and environmentally friendly ... [https://www.sciencedirect.com/science/article/abs/pii/S2352152X25024338]
- 79. Quantification study of mental load state based on AHP ... [https://link.springer.com/article/10.1007/s40747-023-00994-9]
- 80. Computational insights into the electrochemical performance ... [https://pubs.rsc.org/en/content/articlehtml/2025/ra/d5ra06452j]
- 81. Electrode-level strategies for high-Ni cathodes in ... [https://www.oaepublish.com/articles/energymater.2025.57]
- 82. Evaluation of nanostructured electrode materials for high- ... [https://www.aimspress.com/article/doi/10.3934/era.2023117]
- 83. Performance evaluation and multi-objective optimization of ... [https://www.nature.com/articles/s41598-025-15756-5]
- 84. A comparison between TOPSIS and SAW methods [https://link.springer.com/article/10.1007/s10479-023-05339-w]
- 85. Comparison Analysis of AHP-SAW, AHP-WP, AHP-TOPSIS ... [https://www.mecs-press.org/ijmecs/ijmecs-v15-n1/v15n1-3.html]
- 86. Sensitivity analysis approaches in multi-criteria decision ... [https://www.sciencedirect.com/science/article/pii/S156849462300933X]
- 87. What electrode material should I use for resistance spot ... - TWI [https://www.twi-global.com/technical-knowledge/faqs/faq-what-electrode-material-should-i-use-for-resistance-spot-welding]
- 88. What are the common electrode materials for a spot ... [https://www.dragon-welding.com/blog/what-are-the-common-electrode-materials-for-a-spot-welding-machine-717323.html]
- 89. Choosing the Right Material for Spot Welding Electrodes [https://metalcutting.com/knowledge-center/choosing-the-right-material-for-spot-welding-electrodes-2/]
- 90. The analytic hierarchy process for the selection of water ... [https://www.sciencedirect.com/science/article/abs/pii/S0013468624017353]
- 91. Multiple-criteria decision analysis [https://en.wikipedia.org/wiki/Multiple-criteria_decision_analysis]
- 92. Multi-Criteria Decision Making (MCDM) Methods and ... [https://www.mdpi.com/2673-8392/3/1/6]
- 93. A comparative analysis of VIKOR and TOPSIS [https://www.sciencedirect.com/science/article/abs/pii/S0377221703000201]
- 94. Multi Criteria Decision Analysis (MCDA). All You Need to ... [https://www.6sigma.us/six-sigma-in-focus/multi-criteria-decision-analysis-mcda/]
- 95. An Introductory Guide to Multi-Criteria Decision Analysis ... [https://analysisfunction.civilservice.gov.uk/policy-store/an-introductory-guide-to-mcda/]
- 96. Statistical and analytical comparison of multi-criteria ... [https://www.sciencedirect.com/science/article/pii/S2214716016300483]